By Rick Tobin
None of us have ever seen such wide-ranging extremes of economic and asset trends as we’ve seen over the past few years. In many ways, it’s like we’re on a giant yo-yo swinging wildly from side to side or on a bumpy roller coaster ride with wicked twists and turns that keeps moving onward for years at a time instead of over just a minute or two.
All of the economic jerking that we feel on a daily basis can be overwhelming. Some days we see very positive news which gives us hope for a bright future. Other days, the gloomy negative news can seem a bit shocking because much of these positive and negative economic data trends have never been experienced in past years or decades.
Let’s review some of the key economic data trends that swing from very bad to very good (or vice versa) in hours, days, weeks, months, or over the past few years:
ADVERTISEMENT
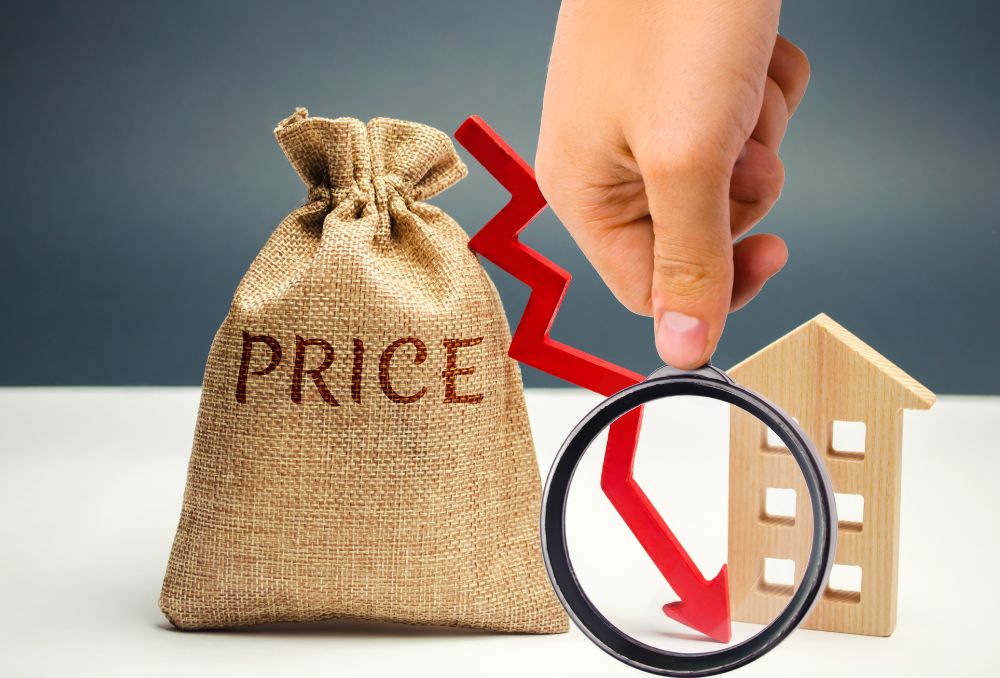
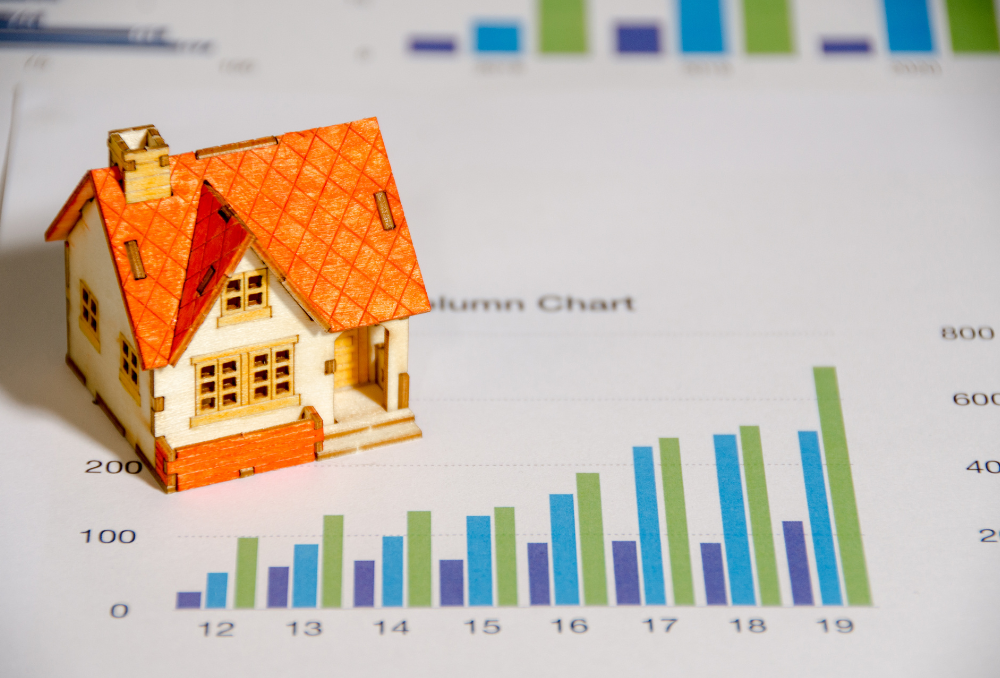
Home Price Changes
Nationally, home prices have risen consistently since 2011. Investor home purchases fell the most on record in the 4th quarter of 2022 at a whopping -46% decline pace. Home prices fell for six months in a row since peaking in July 2022 through the end of January 2023, according to the Case-Shiller U.S. National Home Price Index.
A booming home price example: A young family purchases a new starter home for $300,000 in January 2020 shortly before the global pandemic designation. That same home would’ve peaked at $435,000 in the summer of 2022 using the same Case-Shiller data trends. If so, the family gained $135,000 in newfound equity in just 18 months or so.
The most horrific housing crash in US history took place between the market peak in 2006 and 2012 when the national housing average fell – 27%. California’s home losses were much more extreme with the peak to trough bubble burst falling as much as -41%.
Between 2019 and peak prices near the summer of 2022, many regions had home appreciation percentages of somewhere between massive 50% and 100%+ gains. Future home losses will need to be significant and the worst ever in national history to turn recent home purchases negative.
For people who’ve owned their homes for many years or decades, they will be more likely to ride out any significant price drops in the future. However, buyers who purchased with anywhere between 0% and 5% down in recent years may soon go underwater with the mortgage debt surpassing the market value.
Year-over-year home sales fell between 37% and 47% in Southern California counties through January. As sales volume declines, home price drops tend to follow even if most sellers aren’t willing to do it at first because they want peak record high prices like last seen in 2022.
Fewer buyers means less competition for quality properties and may lead to home listing price cuts and increased closing cost credits from sellers to buyers.
Commercial real estate properties: Upwards of 50% of all commercial property mortgage debt is a floating or adjustable rate. Additionally, the cost to insure the interest rate cap derivatives contract that protects both borrowers and lenders from the increasing risks associated with rising rates has increased 10-fold for borrowers, as per the Wall Street Journal. As such, it’s a double whammy for commercial mortgage borrowers in that both their mortgage and insurance rates have skyrocketed over the past year. The commercial sector is still getting hit harder than residential.
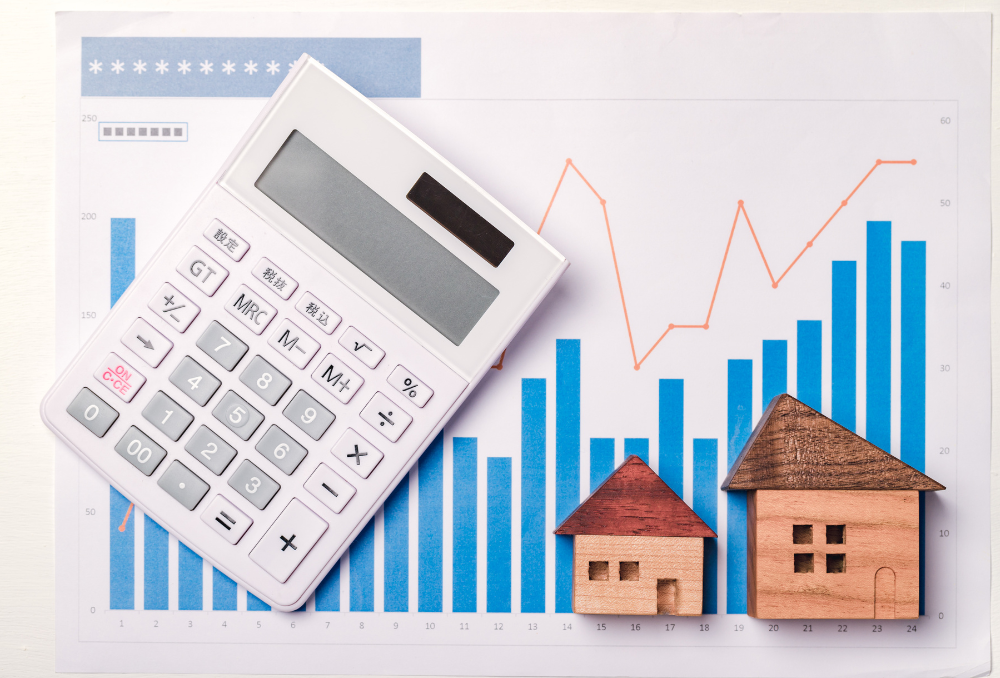
Listing Supply
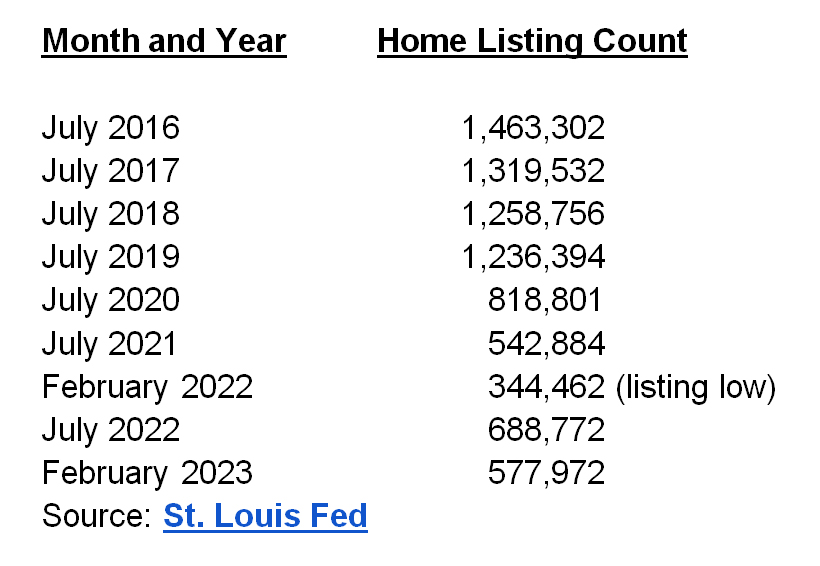
The St. Louis Fed and Realtor.com share data together which shows both the current and past history for single-family homes, townhomes, and condominiums across the nation at any given time. As with other products available for purchase, a lower supply of something like eggs or popular toys will likely lead to higher prices due to the demand exceeding the available supply. Conversely, an oversupply of a product and falling demand will cause prices to fall.
Let’s review the national home listing trends dating back to 2016:
The US Census Bureau recently published data for the 4th quarter of 2022 which showed that there were 15 million vacant housing units (homes, condos, and rental apartments).
Vacant “shadow inventory” homes that are NOT listed for sale absolutely dwarf the total number of listed homes nationwide by a significant multitude. This has been true since at least 2009. If just 5% or 10% of the “shadow inventory” homes suddenly changed to homes available for sale, it could double the size of the national listing supply. “Shadow inventory” homes can also include homes already foreclosed upon by banks or mortgage loan servicing companies that are not offered up for sale.
Mortgage Rates
Approximately 75% of all homes nationwide were purchased with mortgages in recent years. Almost every boom and bust housing cycle over the past 50+ years was directly related to mortgage rate trends.
Between April 1971 and September 2022, the average 30-year fixed mortgage rate was 7.76% as per Freddie Mac. Today’s rates for borrowers with average FICO scores near 690 have fluctuated between 7% and 8% in recent months. The main difference today is that mortgage balances are two, three, four, or five times larger than in decades past.
We’re in the midst of the fastest mortgage rate increase in US history. The Federal Reserve’s rate hikes at a record pace over the past year are likely to later pivot and become massive rate cuts at some point in the future like we saw shortly after the 2008 housing bubble burst.
For comparison purposes about rate hikes, the Fed increased rates 17 times between June 2004 and June 2006 while pushing rates from 1% to 5.25% over 24 months while much smaller rate hikes that were closer to .25% at a time. This was the catalyst for the housing bubble burst later as so many adjustable rate option-like pay ARM mortgages and HELOCs doubled or tripled in monthly payment amounts.
Between the 1st quarter of 2022 and the 1st quarter of 2023, we’re on pace to increase rates 4.25% just like during the 2004 to 2006 era while doing it in about half the time (12 months instead of 24 months).
As of July 2022, approximately 80% of all open residential mortgages nationwide were priced at a fixed 4% rate or lower as per CoreLogic. Approximately 40% of all US residential mortgages were financed or refinanced near peak lows in 2020 or 2021.
Key point: The Primary Mortgage Market Survey conducted by Freddie Mac found that 99% of all residential mortgages nationwide had existing fixed rates lower than the national fixed rate average during the first week of March 2023.
ADVERTISEMENT
Three years ago near the start of the “pandemic” declaration in March 2020, the 10-year Treasury yield hovered close to an incredibly low and rather spooky 0.666% yield. The 30-year fixed mortgage rate is tied to the directions of the 10-year Treasury yield. Today’s 10-year Treasury yield closed at 3.966% on March 6, 2023 by comparison, which was about 3.3% higher.
Historically, the 30-year mortgage rate pricing is about 1.7% over the 10-year Treasury yield (0.6630 + 1.7% margin = 2.363% 30-year fixed mortgage rate, approximately). Over the past year, the margin has widened considerably to 3% or 4% over and above the 10-year Treasury yield to arrive at the latest 30-year fixed mortgage. This widening of the margin was partly due to perceived worsening financial conditions and the Fed’s Quantitative Tapering strategies which included their attempt to sell off trillions of dollars’ worth of mortgage bonds in spite of their being few buyers.
As a result, the 30-year fixed mortgage rate skyrocketed faster than ever to reach somewhere between 6% and 8%, depending upon the borrower’s FICO score and other creditworthiness guidelines.
Mortgage Applications
The lowest mortgage application reading of the 21st century was reached as of the 1st quarter in 2023 due to rising rates. By comparison when mortgage rates were at or near all-time record lows, there were 23.3 million home loan applications completed by consumers, according to the Consumer Financial Protection Bureau.
M1 and M2 Money Supply
“M1 is the money supply that is composed of currency, demand deposits, other liquid deposits—which includes savings deposits. M1 includes the most liquid portions of the money supply because it contains currency and assets that either are or can be quickly converted to cash. However, “near money” and “near, near money,” which fall under M2 and M3, cannot be converted to currency as quickly.” – Investopedia
The federal government has not published data about M3 since 2006. Our national money supply trends are more of a factor for causing rising inflation or falling deflationary trends more so than consumer spending.
High
The M1 money supply from $4 trillion to $20 trillion between just January 2020 and October 2021.
Low
M2 is a measure of the money supply which includes cash, checking deposits, and other types of deposits that are easily convertible to cash such as CDs. Last year was the first time when bank deposits declined within the same year since 1948. This is partly why banks are finally starting to offer higher savings rates to attract more deposits because they’re running low on cash.
The M2 year-over-year growth swung from one extreme to another between 2020 and 2023. It peaked at a +26% year-over-year growth in 2021 and later collapsed to a -2% by early 2023. In the past, a negative M2 money supply that was contracting was a foreboding or ominous sign of an upcoming economic recession or severe depression like seen back in the 1920s.
The M1 and/or M2 money supply directional trends tend to mirror inflation or deflation trends. The more money that is created, the more likely that inflation will rise as well while pushing assets like stocks and real estate much higher. Conversely, a falling money supply can create a deflationary economic cycle when asset prices fall as well.
Savings: US savings rates reached an all-time record low by the 1st quarter of 2023.
Stocks
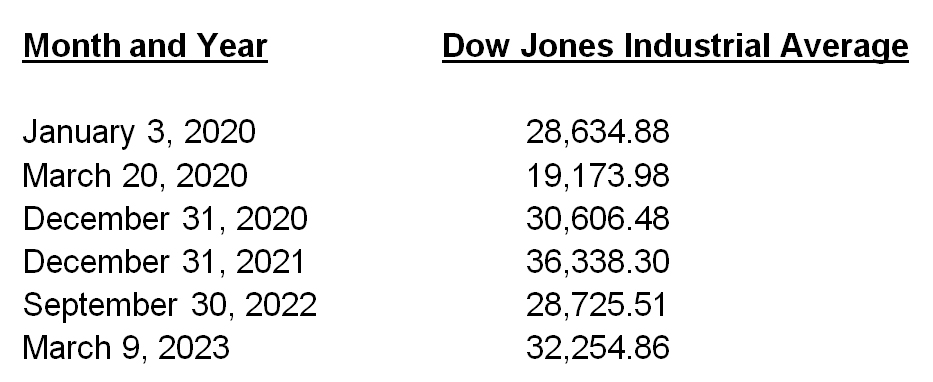
Let’s take a closer look at some key dates for the Dow Jones stock index to get a better understanding of how wildly stock prices have swung over the past three years:
The Dow Jones stock index fell from a peak high of 29,551.42 on February 12th to a market low of 18,213.65 on March 23rd in 2020, which is more than a 38% overall percentage loss in just over a month. Of the 10 all-time biggest daily point losses ever for the Dow Jones index, eight of these days took place in either February or March in 2020. By comparison, the then all-time daily Dow Jones point loss record for the infamous day that almost took down the global financial system back on September 29, 2008 was only a -777 daily point loss.
Month & Year / Daily Point Loss
#1: 03/16/2020 / -2997
#2: 03/12/2020 / -2353
#3: 03/09/2020 / -2014
#4: 03/11/2020 / -1465
#5: 02/27/2020 / -1191
#6: 02/05/2018 / -1175
#7: 02/08/2018 / -1033
#8: 02/24/2020 / -1032
#9: 03/05/2020 / -970
#10: 03/27/2020 / -915
Source: Standard and Poors (through 03/27/2020)
Consumer Debt
Mortgage and other consumer debt is at an all-time record high. Credit card debt is near $1 trillion with the highest rates and fees ever averaging over 20%.
Distressed or pre-foreclosure numbers are listed as “below historical averages” today partly due to existing Covid-19 moratoriums. However, the true number of distressed properties that do not have foreclosure filings may later be on pace to reach peak 2008 to 2012 numbers and will likely be led by FHA mortgage defaults (95% to 96.5% LTV is the norm for FHA purchase deals).
After loss of income, the #1 reason why homeowners walk away from their mortgage and let the property go to foreclosure is when it’s upside-down, underwater, or the mortgage debt is higher than the current market value.
The #1 cause of financial insolvency or bankruptcy is related to unpaid medical bills; Americans have never been unhealthier than today, tragically.
Published inflation rates have varied between 6% and 9% in recent months. Yet, the true inflation numbers are closer to 15% to 17% if the federal government used the same data analysis techniques as a few decades ago.
Subprime automobile loans recently surpassed 6%, which is the highest default number ever.
Energy Price Swings
Back in April 2020, oil prices per barrel briefly went negative to reach -37 per oil barrel. As a result, the cost of the barrel itself was more valuable than the oil inside. Energy costs are usually a root cause of both inflation and deflation as we’ve all seen over the past few years. Some oil barrel prices later surpassed $100 in 2022 as many of us saw $5, $6, $7, $8, and $9 per gallon, especially here in California.
Derivatives
At the peak of the last housing bubble burst in 2007 and 2008, the estimated value of the global derivatives marketplace was about $1,500 trillion. Today, the global derivatives market is closer to $3,000 trillion and may reach closer to $4,000 trillion by 2027 if the same annual growth rates continue, as per Globe Newswire. The frozen global derivatives market was the main cause of the Credit Crisis or Great Recession back in 2008.
A derivative is a hybrid financial and insurance instrument that can be leveraged up to 50 times. Or, it’s a glorified bet on the future direction of things like interest rate directional trends as seen with interest rate option derivatives. Even though us mortgage brokers and real estate investors were blamed by the media for the Credit Crisis, defaulted subprime mortgage debt represented less than 1% of all debt that imploded back then.
Denial or Research – Pick Your Poison or Solution
What we avoid in life controls us. It’s usually best to research as many different positive, neutral, or negative sides to any story or asset class like real estate. You’re more likely to survive any economic downturn if you make precautionary plans and keep your eyes wide open for new opportunities that few others around you can see at the time.
Denial is usually the most common first reaction when presented with dissenting opinions or scary topics, especially if you work or invest in the real estate or financial sectors. Yet, you must thoroughly analyze all sides, question everything (especially your own perspectives), and focus on the potential opportunities or solutions.
The harder we fall, the higher we bounce back, hopefully. If the Federal Reserve does a massive pivot and starts cutting rates again and increasing their Quantitative Easing strategies with more asset purchases (stocks, bonds, and mortgages) to boost the economy again, the market may do another positive market swing skyward. Only time will tell, so get your popcorn ready!
Rick Tobin
Rick Tobin has worked in the real estate, financial, investment, and writing fields for the past 30+ years. He’s held eight (8) different real estate, securities, and mortgage brokerage licenses to date and is a graduate of the University of Southern California. He provides creative residential and commercial mortgage solutions for clients across the nation. He’s also written college textbooks and real estate licensing courses in most states for the two largest real estate publishers in the nation; the oldest real estate school in California; and the first online real estate school in California. Please visit his website at Realloans.com for financing options and his new investment group at So-Cal Real Estate Investors for more details.
Learn live and in real-time with Realty411. Be sure to register for our next virtual and in-person events. For all the details, please visit Realty411.com or our Eventbrite landing page, CLICK HERE.