Inflation, Home Price Swings, and Wealth Distribution

By Rick Tobin

Between January 2020 and October 2021, the M1 money supply (cash or cash-like instruments) quickly rose from $4 trillion up to $20 trillion in just 22 months. Money velocity, or money creation speed, is the true root cause of rapidly declining purchasing power and skyrocketing inflation. The more money in circulation, the less purchasing power for the dollar.


article continues after advertisement


In January 2024, Americans were paying $213 per month more to purchase the same goods and services one year earlier in 2023 because of rising inflation and the declining purchasing power of the dollar. As compared with two years ago in 2022, Americans are paying $605 more per month. Sadly, we’re now paying $1,019 more PER MONTH ($12,228 more per year) today for the same goods and services we purchased three years ago in 2021.

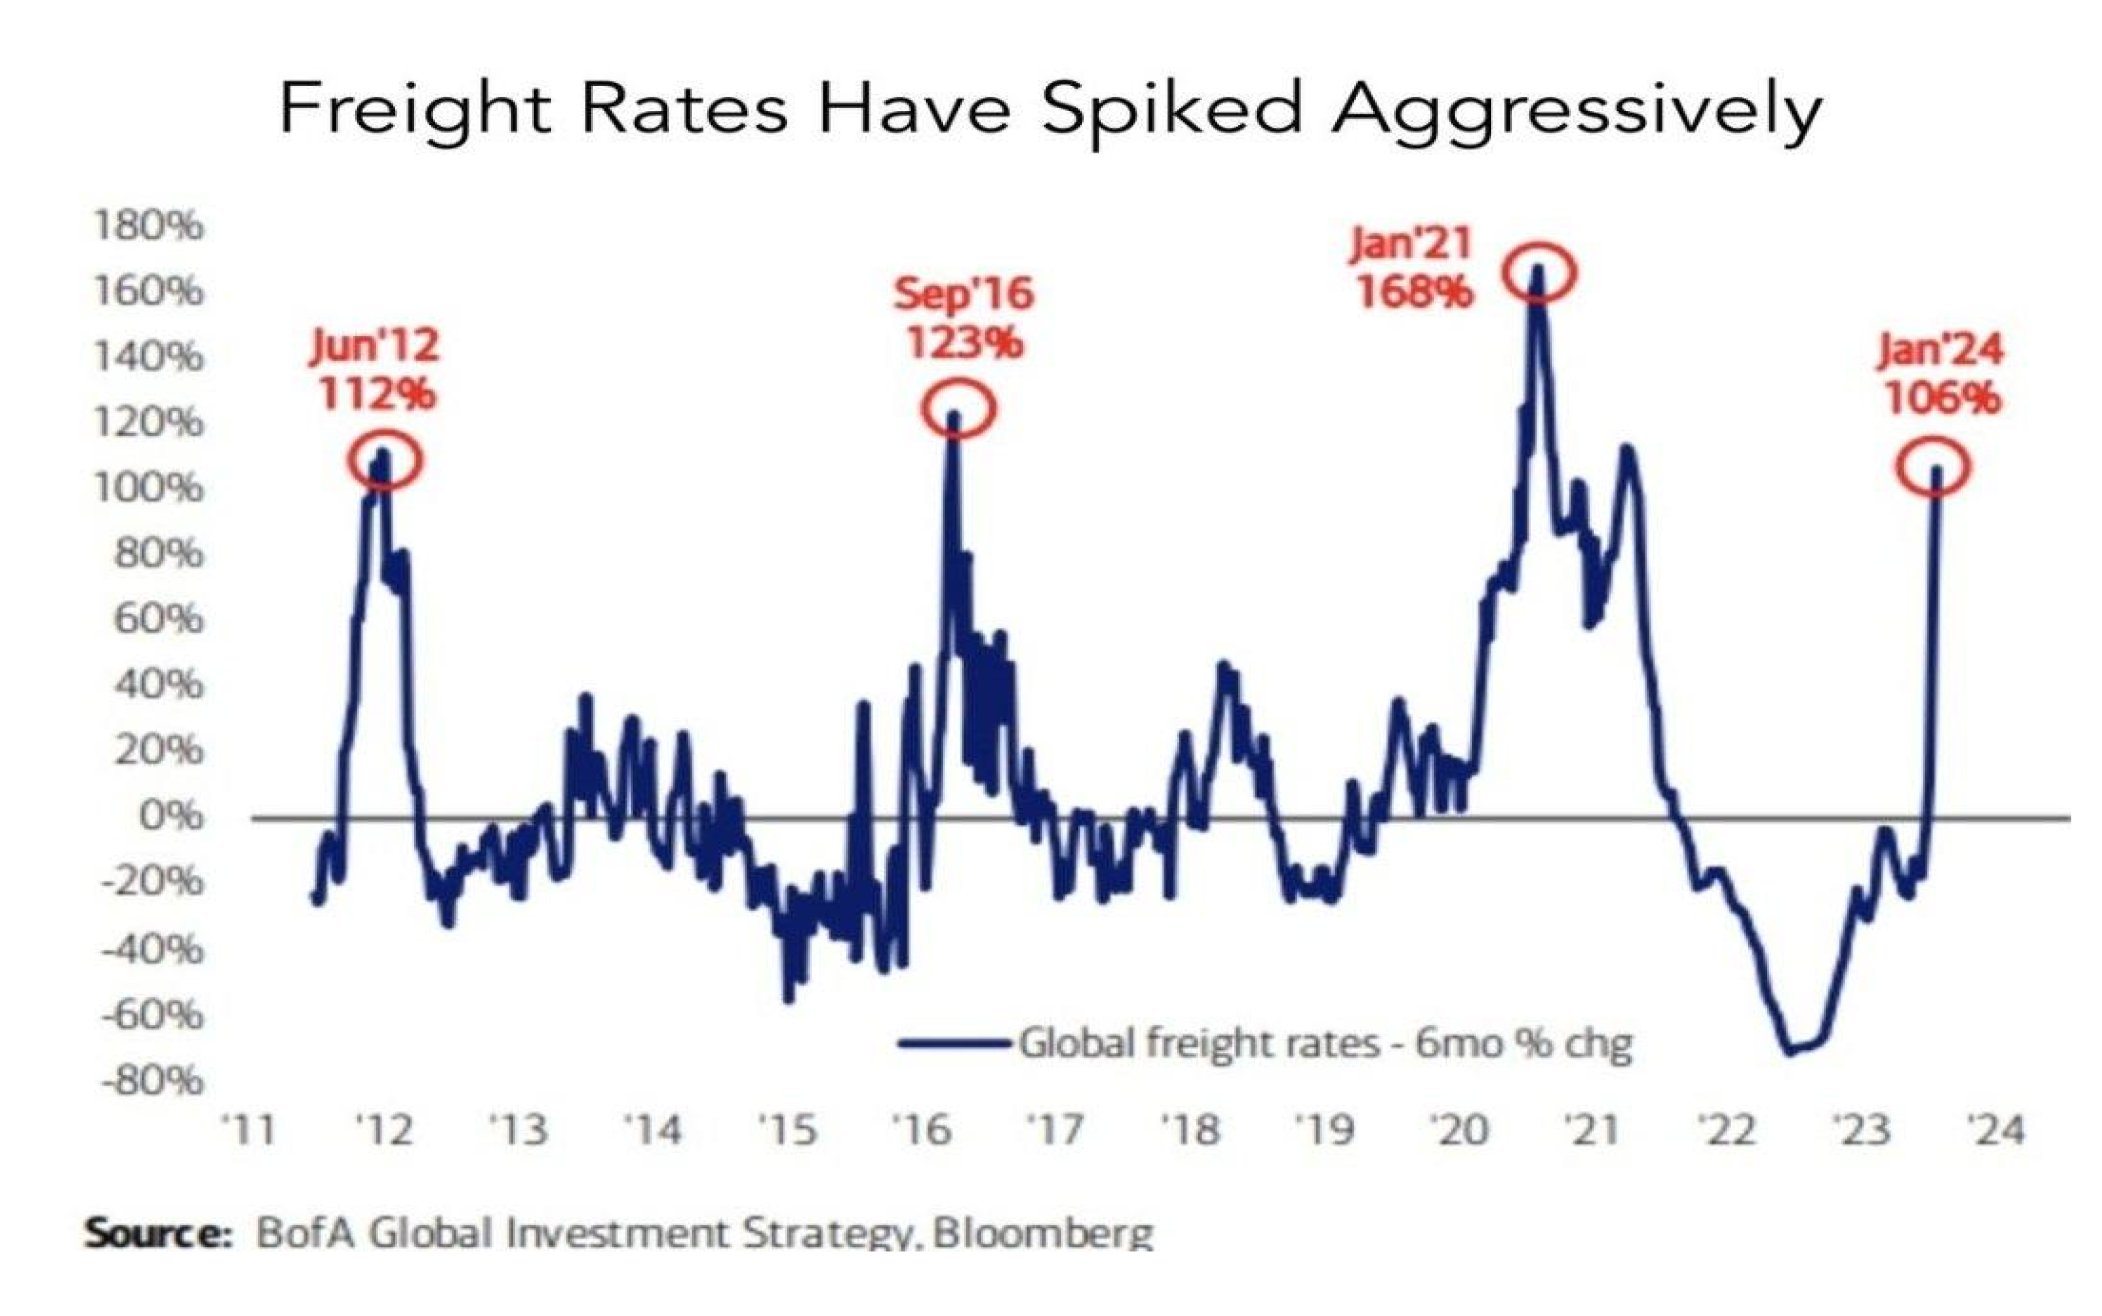
Shipping, trucking, and other transportation costs are quickly rising amid geopolitical tensions. Historically, increasing transportation and energy costs are a root cause of inflation trends. Don’t be surprised if inflation rates and interest rates are both higher later this year instead of lower.

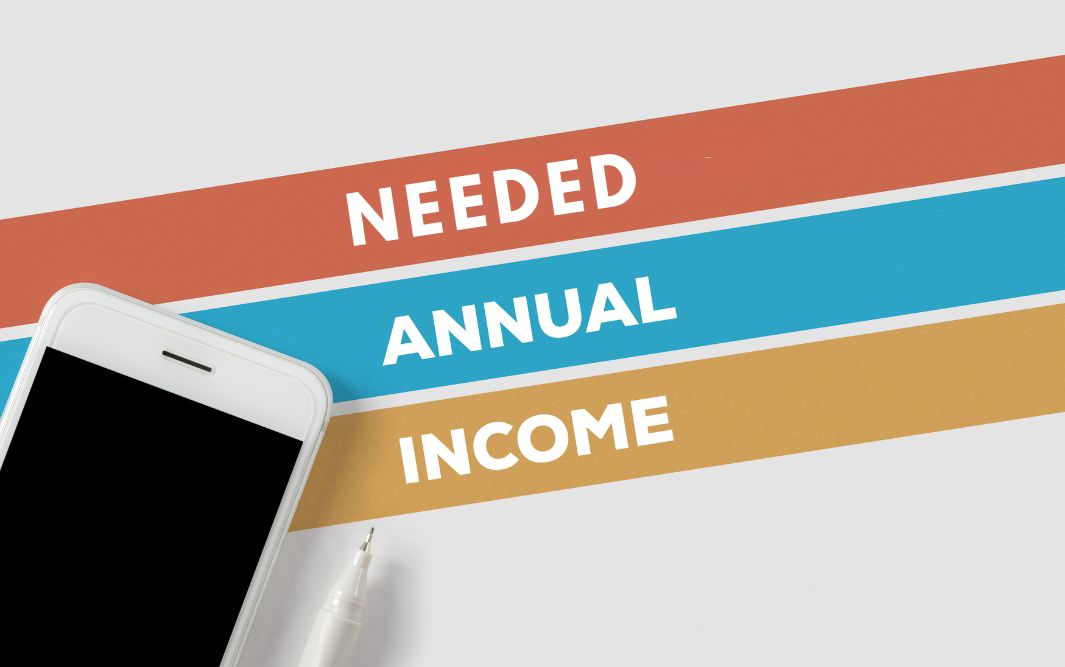
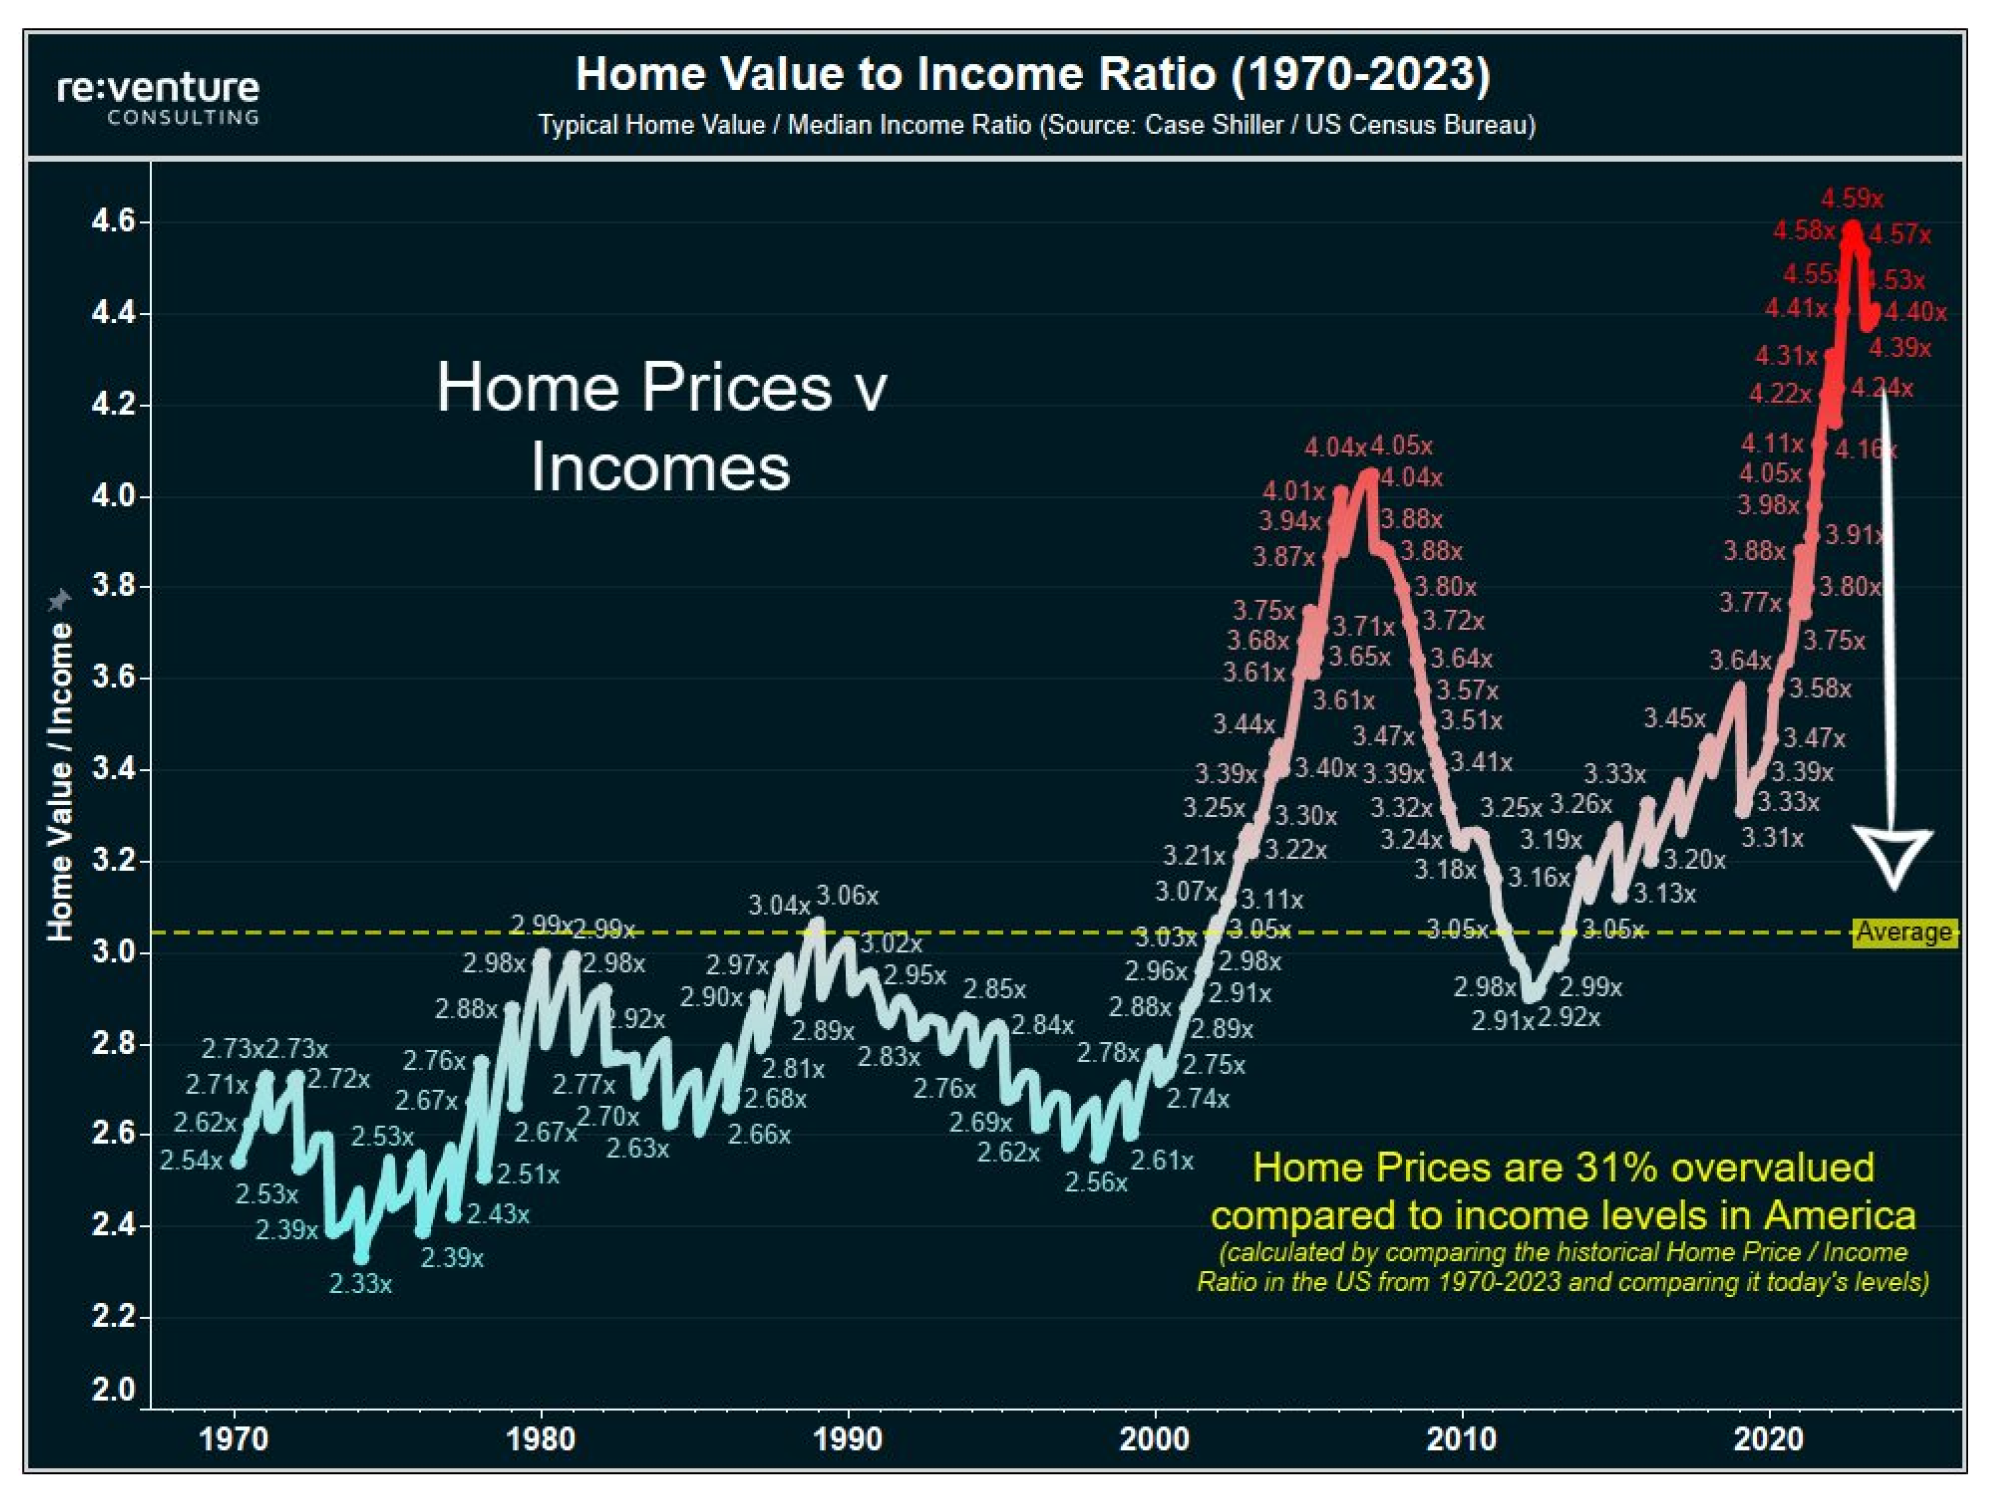
Home Value-to-Income Ratio in the U.S.

The U.S. home value-to-income ratio is calculated by dividing the $342,000 median home value by the $74,580 median household home, according to Economy Vision. If home prices had grown at the same rate as income since 2000, the median U.S. home would cost nearly $294,000, or 31% to 32% lower than today’s prices.

U.S. households need an average income of $166,600 to afford a home, but the median household income is $74,580. The lowest home price-to-income ratios in large metropolitan regions are in Pittsburgh (3.2x), Buffalo (3.5),and Cleveland (3.5), while many California regions are near 10 to 20x. Some smaller suburban or rural regions in Southern Illinois and other Midwest regions are closer to 1.5 to 1.8 for home price-to-income ratios.

Increasing Distressed Residential and Commercial Mortgage Numbers

Millions of Distressed Residential Mortgages

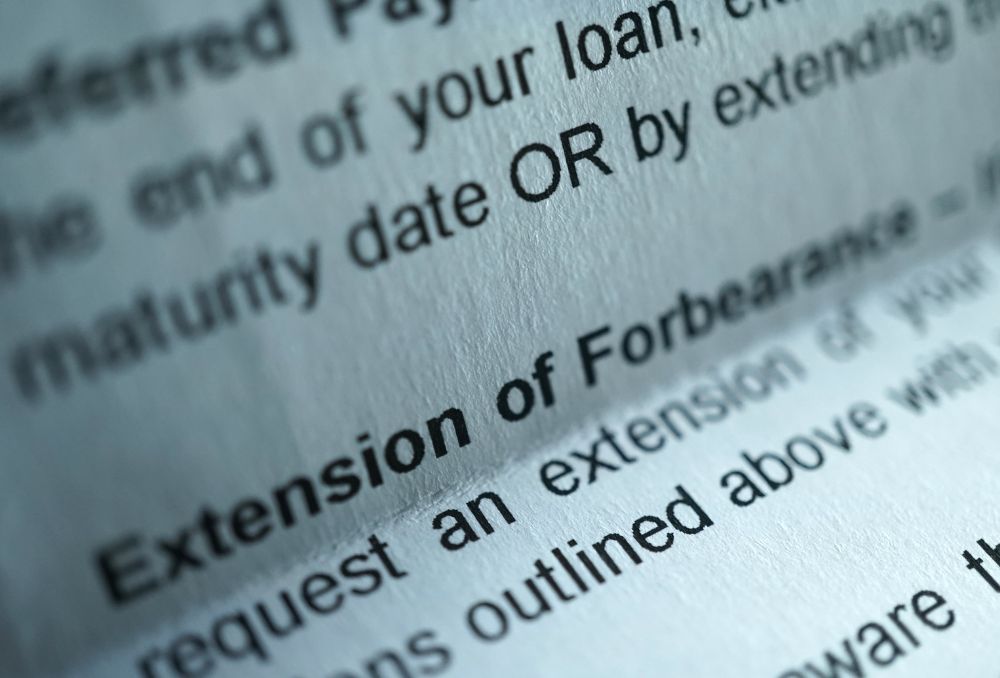
The federal government keeps extending the millions of distressed FHA and VA loans, or offering discounted loan modifications, partly so that they don’t push the national home listing supply skyward and reduce home prices at the same time.

The C-19 foreclosure or forbearance moratoriums for millions of FHA and VA borrowers began back in the fall of 2020. As a result, many of these home borrowers haven’t made a mortgage payment for more than three years.

The FHA forbearance moratoriums for FHA borrowers expired on November 30, 2023 while the VA forbearance moratoriums were extended until May 31, 2024. At some point, these loans will need to be brought back current, sold, or foreclosed.

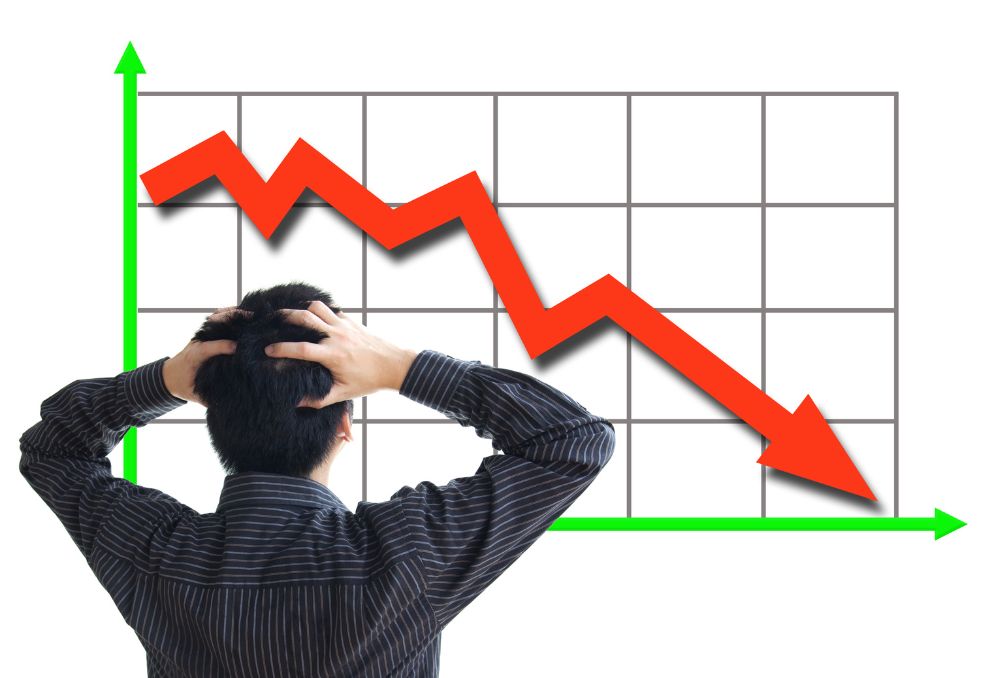
In the previous housing crash that was especially bad during 2008 to 2012, only about 2% (or 1 in 50 mortgages) of all residential loans were delinquent. Yet, these distressed home mortgages became future lower value comps for the nearby homes while driving their prices downward too, sadly.

If and when the national home listing supply numbers rapidly increase this year, it will eventually have a negative impact on home price trends because it’s all supply-and-demand economics at the true core. When supply of a product or asset rises and exceeds buyer demand, then prices tend to fall (and vice versa).

Concerning Commercial Mortgage Trends

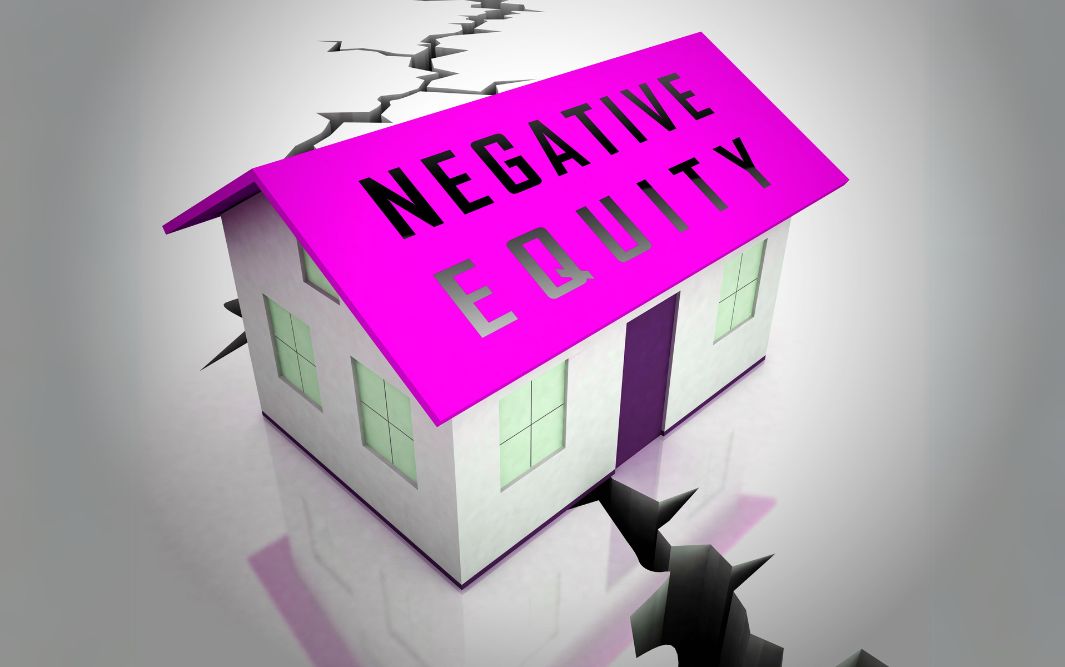
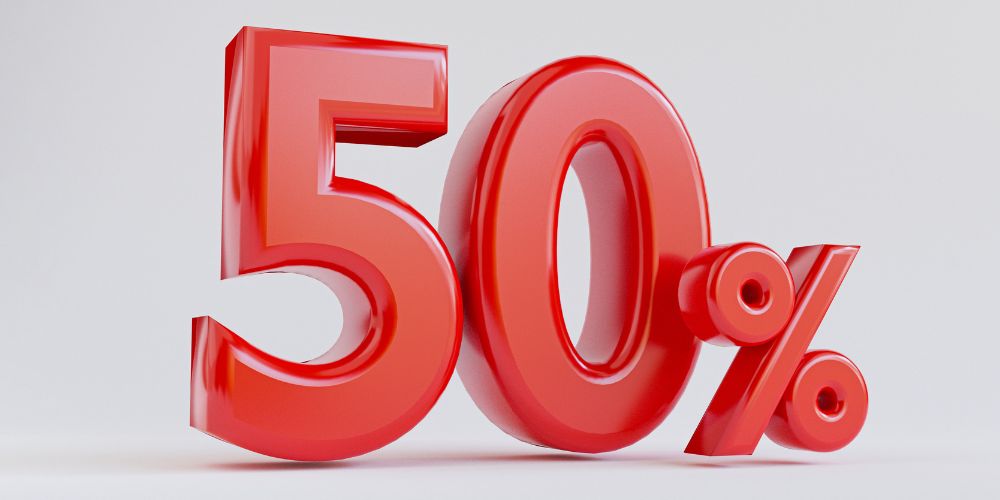
An estimated 44% of office buildings nationwide with mortgages in place are claimed to be upside-down with negative equity here near the start of 2024. Some office buildings are selling for as low as $9 per square foot, not $900/sq. Ft. By the end of 2024, the underwater office building numbers may be well over 50% and the overall underwater or upside-down numbers for all commercial property types may be somewhere within the 20% to 25% range.

Physical and Online Retail Store Numbers

  • In Q3 2023, the amount of U.S. retail space available for lease plunged to an all-time low since the CoStar commercial real estate group started tracking back in 2007.
  • The previous seven years in a row (2017 – 2023) shattered all-time retail space closings per square foot in U.S. history.
  • Through just September 2023, 73 million square feet of retail space closed in 2023, as per Coresight.
  • 140 million square feet of retail space has been demolished in the last decade, according to CoStar.
  • Top 6 online sales percentages in 2023: 1. Amazon (37.6%); 2. Walmart (6.4%); 3. Apple (3.6%); 4. eBay (3%); and 5. Target and Home Depot (a tie at 1.9% each), per Statista.
  • 10.4% of total annual U.S. retail sales were online in 2017;
  • 12.2% of total annual retail sales were online in 2018;
  • 13.8% of total annual retail sales were online in 2019;
  • 17.8% of total annual retail sales were ecommerce in 2020;
  • 18.9% of total annual retail sales were ecommerce in 2021; &
  • 18.9% of total retail sales were online in 2022, per Statista.
  • The full 2023 online year results weren’t published yet.

Record-High Car Payments

Some new monthly car payments are reaching $3,000 per month, while average new car payments are near $730 to $750 per month. Additionally, many monthly car insurance payments are reaching $400 to $500 per month in cities like Detroit and Philadelphia. How much are these car owners paying in gas and maintenance as well?

The national average cost for car insurance rose a whopping +26% from last year, according to Bankrate.

The most expensive cities for car insurance are:

Detroit – $5,687
Philadelphia – $4,753
Miami – $4,213
Tampa – $4,078
Las Vegas – $3,626

The cheapest cities are:

Seattle – $1,759
Portland – $1,976
Minneapolis – $2,044
Boston – $2,094
Washington D.C. – $2,430

The average car loan today is valued at 125% LTV (loan-to-value) for the typical car on the road with a loan with an average negative equity balance of -$6,000. This is partly because so many car buyers are purchasing cars with no money down and adding their registration, licensing, taxes, and warranty fees on top of it before driving off of the car lot. New cars usually drop in value about 20% in the very first year of purchase.


article continues after advertisement


Inflationary or Deflationary Economic Cycles

Inflation has been described as an increase in the general level of prices of a certain product in a specific type of currency. Inflation can be measured by taking a “basket of goods,” and then comparing them at different periods of time while adjusting the changes on an annualized basis.

General inflation measures the value of a currency within a certain nation’s borders, and refers to the rise in the general level of prices. Currency devaluation measures the value of currency fluctuations between different nations. Some related terms associated with inflation are as follows:

* Deflation is a rise in the purchasing power of money, and a corresponding lowering of prices for goods and services. The Fed doesn’t like this economic period of time and will probably cut short term rates to offset it.

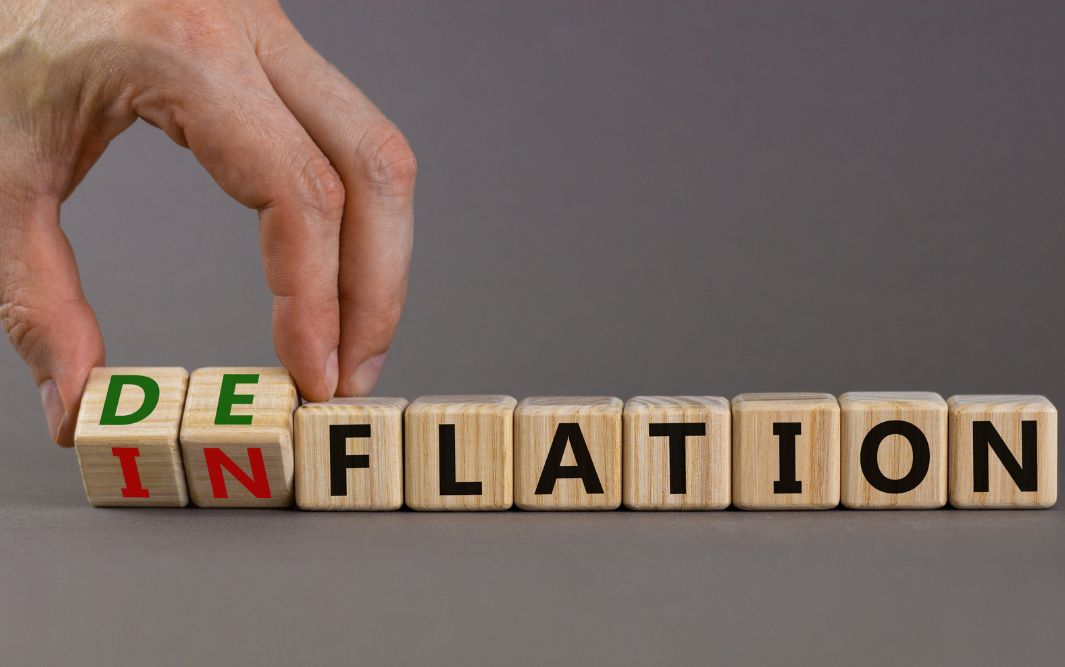
* Disinflation refers to the slowing rate of inflation. The Fed may like this type of economic time period, and may stop raising rates at this point in the economic cycle.

* Reflation is the period of time when inflation begins after a long period of deflation. Depending upon the severity of inflation, the Fed may pause the rate hikes or gradually begin rate hikes.

* Hyperinflation is rapid inflation without any tendency toward equilibrium. It is inflation which compounds and produces even more inflation. It is when inflation is much greater than consumers’ demand for goods and services. The Fed, and the rest of America, do not typically like this economic period, so they may enact a series of significant rate hikes to slow inflation.

The Wealth Distribution Imbalance

Wealth distribution across the U.S. has become increasingly concentrated in the hands of fewer people since 1990. Overall, the top 10% of wealthiest Americans own more than the bottom 90% combined, with more than $95 trillion in wealth for the top 10%.

Here in 2024, the share of wealth held by the richest 0.1% is near its peak with a minimum of $38 million in wealth in just 131,000 households.

With $20 trillion in wealth, the top 0.1% earn an average of $3.3 million in income each year. The greatest share of the wealth owned by the top 0.1% is held in corporate equities or stocks and in mutual funds, which make up over one-third of their total assets.

Households in the lower-middle and middle classes as found in the 50% to 90% income and asset brackets are claimed to have a minimum of $165,000 in wealth held primarily in real estate and followed by pension and retirement benefits.

Unless you’re in the Top 0.1%, the odds are quite high that the bulk of your wealth is concentrated in real estate if you’re fortunate enough to own at least one property today. In our next meeting, we will discuss how to find discounted real estate and other investments and how insurance and estate planning can help protect your assets for you and your family.

Extreme Rate Swings, Steady Home Gains

Between 2000 and 2023, the median U.S. home appreciated approximately 10.63% per year. By comparison, California homes rose 12.55% per year between 2000 and 2023.

Doubling Value Forecasts: The Rule of 72 is an investment formula used to estimate how long it may take for an asset to double in value using a projected annual rate of return (72/7 or 7% = 10+years).

A home purchased using the national average annual gain of 10.63% would double in value in just over 6.77 years if purchased this year (72/10.63 = 6.77 years). A California home would double in just 5.74 years (72/12.55) if these same average annual appreciation gains continued.

Home prices tend to go skyward following a Fed pivot when they start slashing rates. When will the Federal Reserve start cutting rates again? Let’s take a look at their calendar for 2024 two-day meeting dates: Jan. 30-31 (no rate change); March 19-20; April 30- May 1; June 11-12; July 30-31; Sept. 17-18; Nov. 6-7; & Dec. 17-18.

Inflation severely damages the purchasing power of the dollar while usually boosting real estate values. Because it’s more likely than not that inflation will continue rising above historical average trends, then real estate may be one of your best hedges against inflation as your wealth compounds and increases as well.

Rates may be lower, the same, or higher by the end of 2024, partly due to our volatile inflation movement and weakening dollar. However, there’s a tremendous upside for real estate investors if you’re willing to stay focused on the opportunities and not let the negative news scare you away.


Rick Tobin

Rick Tobin has worked in the real estate, financial, investment, and writing fields for the past 30+ years. He’s held eight (8) different real estate, securities, and mortgage brokerage licenses to date and is a graduate of the University of Southern California. He provides creative residential and commercial mortgage solutions for clients across the nation. He’s also written college textbooks and real estate licensing courses in most states for the two largest real estate publishers in the nation; the oldest real estate school in California; and the first online real estate school in California. Please visit his website at Realloans.com for financing options and his new investment group at So-Cal Real Estate Investors for more details. 


Learn live and in real-time with Realty411. Be sure to register for our next virtual and in-person events. For all the details, please visit Realty411.com or our Eventbrite landing page, CLICK HERE.

How to Minimize Risks and Maximize Gains

By Rick Tobin

Between January 2020 and present day, U.S. home prices rose a staggering +47%, per S&P CoreLogic Case-Shiller. Are these price trends likely to keep rising at the same pace or not?

How is it possible that the reported published inflation rates are declining while home prices and home unaffordability rates are increasing at the same time?

Will home prices decrease, flatten, or increase later here in 2024? The answer partly depends on whether the home listing inventory supply rapidly increases or decreases. It’s all supply and demand economics at the true core.


article continues after advertisement


Let’s take a closer look at some eye-opening housing, inflation, and jobs numbers:

  • Before the Fed started raising rates in 2022, a $2,000 monthly housing budget would have bought a home costing more than $400,000. Today, a $2,000 monthly household budget gets $295,000 or less.
  • Existing home sales between 1998 and 2007 averaged 6 million per year. Through October 2023, the annual home selling pace was closer to 3.79 million housing units.
  • Over the past 50 years (1973 – 2023), home prices rose by nearly 1,300% as compared with a 610% gain in the CPI (Consumer Price Index).
  • The inflation-adjusted hourly work wage has increased by just a measly 1% over the past 50 years (not an annual 1% increase, but just a 1% total gain over and above 1973’s wages in 2023 at a 1/50th of 1% increase per year average).
  • By comparison, the inflation-adjusted median home price has gained 100% over the past 50 years. As a result, real home prices have increased by more than 100 times (or 100x) the real wage gains.

Sources: CPI, Federal Reserve, and ZeroHedge

To be able to afford the median-priced home of $433,100 in late 2023, a household needed an annual income of roughly $166,600. However, the median household nationwide earns just $74,580, which is only 45% of the recommended amount.

By comparison, the median-priced home in California reached almost $860,000 in recent months. This is almost double the national median-priced home average.

As it relates to the lock-in effect, it does not matter too much if the homeowner’s mortgage rate is 6%, 4%, or 2% if they lose their job and main source of income. Foreclosures will likely rapidly increase this year as the true unemployment numbers skyrocket, sadly. It then creates a downward spiral for the neighboring homeowners as future foreclosures become the latest sales comps while creating more upside-down homes with negative equity. Later, more underwater homeowners will walk away if they have no equity to protect.

The latest house payment ($62,165) as a percentage of household income ($94,964) number ratio is 65.46% here in California ($62,165/$94,964 = 65.46%).

Approximately 60% of all homes owned in America are owned by people over the age of 50. Average home prices across the nation have increased 45%+ since the pandemic declaration back in March 2020. At some point, more older Americans will likely list their homes for sale to take their gains and to downsize at the same time while pushing the home listing inventory numbers higher.

If you have cash or access to third-party loans or equity partners, there will be some incredible buying opportunities this year and beyond.

Water Damage and Extreme Weather Swings

It’s getting increasingly difficult to obtain insurance for both owner-occupied and rental properties. A mortgaged residential or commercial real estate property is required to have sufficient amounts of insurance coverage, or the lender may consider it to be the equivalent of a mortgage default that would later lead to a foreclosure filing.

The #1 cause of damage to homes is usually excess water from rainstorms, heavy snowfall, floods, leaky roofs, or broken pipes. Fewer than 2% of Californians have flood insurance coverage for their homes. The horrific flooding in San Diego last month will likely cause significant losses for residential and commercial real estate properties as well as push insurance premiums skywards for local San Diego County and statewide residents.

Florida is #1 for the highest annual homeowners insurance premiums that are near $9,270. How much worse will it get after hurricane season begins?

Please make sure that you have multiple insurance coverage options from your preferred insurance broker just in case you receive a cancellation notice in your mailbox in the near future.

Commercial Real Estate

Upwards of 44% of office buildings nationwide with a mortgage are now claimed to be upside-down with negative equity here near the start of 2024. Later this year, the negative equity numbers should keep rising. How will this potentially impact banks and the overall US economy later this year and next?

CNBC recently published this article entilted vacant office spaces on the rise, with over 100 million square feet available in Manhattan.

This 100 million square foot number is equivalent to 40 vacant Empire State Buildings. Occupancy rates for office buildings in that region continue to remain under 50%. How many of these empty offices will later be converted to residential units?

Blackstone, the world’s largest owner of commercial real estate and a spinoff of BlackRock, is walking away from some of their distressed and upside-down commercial properties.

Year-over-year office building price percentage losses (’22 – ’23)
1. San Francisco: -58.9%
2. Chicago: -48.3%
3. San Jose: -48.0%
4. Philadelphia: -45.1%
5. Los Angeles: -44.6%
6. Orange County, CA: -38.4%
7. Dallas/Ft. Worth: -37.6%
8. New York: -37.3%
9. Austin: -31.5%
10. Boston: -24.2%

Source: Green Street News (data for all office sales, not just for Blackstone deals)

There are another one million new rentals coming to market by 2025 over and above the 1.2 million new apartment units that were built over the past three years, according to REjournals. Will this drive down rental prices even more due to excess supply?

Banks

Between 2017 and 2023, more than 10,000 bank branches closed nationwide. From January 1, 2023 through October 19, 2023, banks fired 20,000 employees. Yet, an additional 42,000 bank employees were let go in the final 72 days of the year between October 20th and December 31st for a grand total of 62,000 bank layoffs in 2023. Will these numbers accelerate in 2024?

Next month on March 11th, the Federal Reserve is terminating their “safety net” for many banks that’s called the Bank Term Funding Program (BTFP). After the financial system almost collapsed last year in March 2023, it was the BTFP bailout programs that possibly prevented bank runs after many banks became technically insolvent. On March 12th, private money may become quite popular as a backup lending solution because fewer banks may be able to lend to even their most creditworthy clients.

The banking dominoes continue to fall…

The push towards the “Basel III Endgame” banking regulation, which requires banks with assets over $100 billion to set aside more capital or cash reserves while driving down their ability to lend, is almost here.

Basel is a reference to the city in Switzerland where the world’s superbank, named the Bank for International Settlements, is located. They govern all central banks worldwide, including the Federal Reserve. We may see an increasing number of bank closures and mergers this year and next, partly due to these new regulations.


article continues after advertisement


China’s Defaulting Real Estate Marketplace

Here comes the next potential Asian Contagion event and derivatives debt tsunami from Evergrande (3333.HK stock symbol – they were once China’s largest real estate developer) as I’ve been writing about for several years. Country Garden, also ranked as high as the #1 largest real estate developer in China, is having their own serious financial challenges as well. It could force many Chinese investors to sell off their US Treasury holdings, which, in turn, may drive the 10-year Treasury yield and corresponding 30-year fixed mortgage rates higher.

January 2024 was somewhat reminiscent of the Russian financial crisis (stocks, bonds, and currency implosions) that spread to Asia (aka Asian Contagion) and South America back in 1998. At the same time, the derivatives investments held by Long-Term Capital Management (LTCM) were so volatile and at risk that they ran out of money while almost taking down the world’s entire financial system at the same time.

Several large financial institutions were asked by the Federal Reserve to put upwards of $100 million each to save LTCM’s derivatives bets so that the financial system wouldn’t collapse. The only investment firms that refused to bail out LTCM in 1998 were Lehman Brothers and Bear Stearns. Ten years later in 2008, they were the first big investment firms to implode as the Credit Crisis (primarily related to a frozen global derivatives market) worsened and were not bailed out either, ironically.

Never forget that the global bond and currency markets absolutely dwarf all stock markets combined. Get your popcorn ready and keep a close eye on financial institutions in China, Russia, Germany (Deutsche Bank, especially), and here in the U.S.

Jobs Layoffs and Declining Cash Reserves

Job layoffs accelerated +136% in just one month between January 2024 and December 2023. Cash reserves held at banks are near all-time record lows right now. A recent survey found that 60% of the U.S. population has $500 or less in their checking accounts. Just 12% of the U.S. population has $2,001 dollars or more in their checking accounts, as per GoBankingRates.

Ballooning Corporate Debt

The U.S. corporate loan maturity amounts that ballooned or will be ballooning or coming all due and payable by the following year-end dates:

  • December 2023: $230 billion
  • December 2024: $790 billion
  • December 2025: $1.070 trillion
  • December 2026: $1.105 trillion
  • December 2027: $1.055 trillion
  • December 2028: $1.240 trillion
  • December 2029: $802 billion

Many corporations will be forced to refinance their debt at much higher rates while increasing their costs and decreasing their profits. As a result, more corporations will likely look to reduce their monthly costs, which may include increased job layoffs, sadly.

Between October 2019 and April 2023, there were more jobs created for foreign-born workers than for native American workers, as per ZeroHedge. My guess is that the foreign worker percentages have increased at an even faster pace between May 2023 and January 2024. In 2023, there were more illegal immigrant crossings in the USA each month than the total number of monthly births for US residents.

Government and Consumer Debt

According to Michael Snyder’s article entitled The United States Has The Biggest Government In The History Of The World By A Very Wide Margin, let’s take a look at some of these published numbers:

  • Upwards of 3 million people work for the federal government.
  • The federal government spent 6.13 trillion dollars in 2023. This figure is larger than the GDP of every nation on the planet except for the U.S. and China.
  • More than 70 million Americans are on Social Security.
  • More than 65 million Americans are on Medicare.
  • More than 81 million Americans are on Medicaid.
  • More than 41 million Americans are on food stamps.

Consumer and government spending trends: US households racked up $17.29 trillion in record debt last year (mortgages, credit cards, auto loans, student loans, etc.). The federal US debt crossed another milestone recently, surpassing $34 trillion. By comparison in 2009, US debt was only $10.6 trillion. Between 1980 and 1990, the total overall federal debt only increased by $2 trillion.

We’ve borrowed:
* $1 trillion over the last 3 months
* $2 trillion over the last 6 months
* $11 trillion over the last 4 years

In the previous housing crash here in California (2007 to 2012), average home prices fell to a still all-time state record amount of -41.7% from peak to trough.

  • Nearly 30% of Americans are behind on one or more debt payments.
  • 56 million Americans had unpaid credit card balances for more than a year.
  • 40% of student loan borrowers have still not made a payment even after the recent October 1, 2023 student loan payment restart date after three years of C-19 forbearance.
  • Just one late payment can drop a FICO credit score between 80 and 180 points.

Out of Chaos Comes Opportunity

Inflation is likely to remain elevated here in 2024. Historically, the ownership of real estate has proven to be an exceptional hedge against inflation while rising at a similar pace or higher each year.

With consumer debts at all-time record highs and credit card APR rates hovering between 28% and 30%+ and early paycheck loans reaching as high as 330% to 400% APR rates, it’s very important to limit your spending, set aside as much cash as possible if this may be an option for you, and keep your eyes focused on potential real estate bargains in your region.

During volatile economic time periods like seen back during the Great Depression (1929 – 1939), the Savings and Loan Crisis (‘80s and ‘90s), and the Credit Crisis or Great Financial Recession (2007 to 2012), there were incredible buying opportunities for discounted real estate. Please stay focused on your goals and targets rather than on the temporary obstacles.


Rick Tobin

Rick Tobin has worked in the real estate, financial, investment, and writing fields for the past 30+ years. He’s held eight (8) different real estate, securities, and mortgage brokerage licenses to date and is a graduate of the University of Southern California. He provides creative residential and commercial mortgage solutions for clients across the nation. He’s also written college textbooks and real estate licensing courses in most states for the two largest real estate publishers in the nation; the oldest real estate school in California; and the first online real estate school in California. Please visit his website at Realloans.com for financing options and his new investment group at So-Cal Real Estate Investors for more details. 


Learn live and in real-time with Realty411. Be sure to register for our next virtual and in-person events. For all the details, please visit Realty411.com or our Eventbrite landing page, CLICK HERE.

Stratton Equities: Pioneering the Future of NON-QM Mortgages

PARSIPPANY, N.J.–(BUSINESS WIRE)–In an ever-evolving mortgage lending landscape, NON-QM mortgage loans are emerging as the industry’s future, providing opportunities for a wider range of borrowers to achieve their homeownership and investment goals. Stratton Equities, the Leading Nationwide Private Money and NON-QM Mortgage Lender, has been at the forefront of this revolution for the past six years, setting the pace for other companies to follow.

NON-QM mortgage loans, short for non-qualified mortgage loans, have gained significant traction in recent years as a viable alternative to traditional QM (qualified mortgage) mortgage loans, which come with stringent government regulations and eligibility criteria. Recent statistics reveal that only a small percentage of Americans qualify for QM loans due to these stringent requirements.


article continues after advertisement


According to industry data, the demand for NON-QM mortgage loans has steadily increased yearly, with a notable surge in the past few years. In 2022 alone, NON-QM loans accounted for a significant portion of the mortgage market, surpassing expectations. It has been estimated that one in four loans will go NON-QM in the near future.

Stratton Equities recognized the potential of NON-QM loans six years ago, positioning themselves as pioneers in private money lending, specifically NON-QM mortgage loans. This early recognition of market trends has been the cornerstone of their continued success.

Michael Mikhail, CEO and Founder of Stratton Equities, emphasized their focus on generating NON-QM leads and their commitment to offering a wide range of lending programs, including NON-QM, DSCR, Hard Money, and No-Doc Loans. He stated, “Our aim has always been to provide solutions that cater to a broader spectrum of borrowers. Stratton Equities had the foresight six years ago to recognize the market’s direction, which is why we were at the forefront of NON-QM mortgage lending. This serves as a foundation for our continued success.”

NON-QM mortgage loans are designed to serve most Americans who do not meet the strict eligibility criteria of QM loans. These loans facilitate home ownership, second home ownership, and investment properties, allowing income generation and wealth building for a more diverse range of borrowers. Contrary to misconceptions, NON-QM mortgage loans often offer competitive rates, making them attractive.


article continues after advertisement


Traditional lenders like banks and credit unions primarily offer QM loans for one-to-four-family investment properties. However, these loans have heavy documentation requirements and lower loan-to-value (LTV) ratios, typically capping at 70%. Stratton Equities stands out by providing NON-QM mortgage loans for such properties with easier qualifications, lower documentation requirements, and higher LTV ratios, currently at 80%.

Stratton Equities also recommends closing within an LLC for investment properties due to tax and security advantages. Despite some lingering stigma associated with NON-QM mortgage loans, they often result in lower rates, higher LTVs, and streamlined documentation, making them a practical choice for borrowers.

Educating borrowers about the advantages of NON-QM mortgage loans and dispelling misconceptions is vital. Stratton Equities is committed to leading the way in providing these beneficial lending options and believes in the potential for growth and success in this market. Their loan officers benefit from the advantages offered by the company, including a consistent stream of leads, as exemplified by recent hires who have quickly achieved success within the organization.

Stratton Equities invites individuals and investors to explore the world of NON-QM mortgage loans and discover the possibilities for achieving their financial goals. For more information, please visit www.strattonequities.com.

For more information about Stratton Equities, please visit their website at https://www.strattonequities.com. Follow Stratton Equities on social media on Instagram, Facebook, and YouTube @StrattonEquities, LinkedIn @stratton-equities, and Twitter @Strattonequity.

Contacts
Kelly Bennett, Director of PR
Stratton Equities
[email protected]
(949) 463-6383


Learn live and in real-time with Realty411. Be sure to register for our next virtual and in-person events. For all the details, please visit Realty411Expo.com or our Eventbrite landing pageCLICK HERE.

Stratton Equities is Hiring Mortgage Loan Officers to Join Their Dynamic New Jersey Team and Build a Lucrative Career in the Mortgage Industry

Stratton Equities is looking for loan officers who are ready to say “yes” more and to work with a company that’s invested in their success.

PARSIPPANY, N.J.–(BUSINESS WIRE)–Stratton Equities, the Leading Nationwide Private Money & NON-QM Mortgage Lender, is excited to announce that they are seeking experienced Mortgage Loan Officers to join their headquarters in New Jersey.

This is an incredible opportunity for skilled professionals who want to work with a company that guarantees abundant direct organic daily leads, hands-on management training and support, niche mortgage loan programs with competitive pricing, and advanced mortgage technology.

Mortgage Loan Officers can expect to close their first loan within four to six weeks after the completion of their initial training.

Mortgage Loan Officers who join the Stratton Equities team can expect the following:

  • Stratton Equities provides Mortgage Loan Officers with inbound organic daily leads from borrowers who call or apply directly to their offices inquiring about a mortgage. Not the other way around.
  • Competitive compensation: Stratton Equities offers a highly competitive compensation plan, potentially allowing Mortgage Loan Officers to earn their first year $110,086.26 – $190,677.36.
  • Robust support: Stratton Equities provides Mortgage Loan Officers access to the most extensive library of nationwide private money and NON-QM mortgage loan programs under one roof. This gives multiple solutions to offer borrowers, allowing Mortgage Loan Officers to say “YES” more.
  • Strong resources: Stratton Equities’ interest rates are some of the lowest nationwide in private lending, starting at 6.75%, and can pre-approve a loan in 24 hours.
  • Room for growth: As a rapidly growing company, Stratton Equities offers ample opportunities for advancement and career growth. With a focus on promoting from within, Mortgage Loan Officers who join the team will have the chance to take on new challenges and responsibilities as they progress in their careers.
  • A dynamic work environment: At Stratton Equities, Mortgage Loan Officers will work in a fast-paced, dynamic environment focused on innovation and results. As a part of the loan officer team, you can work directly with prospective real estate investors, entrepreneurs, and borrowers on their real estate endeavors.

If you are an experienced Mortgage Loan Officer looking for an exciting new opportunity to grow your career or a licensed Mortgage Loan Originator that is new to the industry and needs help finding business, then Stratton Equities is the place for you to earn a great income.

This is an incredible opportunity to join a leading nationwide mortgage lender and build a bright future with a company that values its employees and their contributions.

For more information about Stratton Equities, please visit https://www.strattonequities.com.

To apply for a position with Stratton Equities, please visit their careers website at https://www.loanofficerscareers.com. Or you can email a resume to [email protected].

Follow Stratton Equities on social media on Instagram, Facebook, and YouTube @StrattonEquities, LinkedIn @stratton-equities, and Twitter @Strattonequity.

Contacts
For media inquiries and interviews, please contact Kelly Bennett of Bennett Unlimited PR at [email protected].

IS IT CRAZY TO SELLER FINANCE YOUR RENTALS—OR CRAZY NOT TO?

By Eddie Speed

IS IT CRAZY TO SELLER FINANCE YOUR RENTALS—OR CRAZY NOT TO?

We’re now in a note cycle. It’s as obvious to a note guy like me as when an oil guy hits a gusher.

I’ve been a note guy since 1980. As anyone in any phase of real estate knows, the market is constantly changing and evolving. We either change with it or get left behind. I can say from experience that what worked in one decade wouldn’t work in the next. And so on for the next, and the next, and the next.

Which leads us to 2023. We’re seeing a market phenomenon that’s producing a phenomenal opportunity.


article continues after advertisement


I’ve lived through cycles where owning rental properties made a lot of sense financially. But in today’s market, not as much. You owe it to yourself to test your investment strategy. Run the numbers and compare the profit potential of owning rentals versus selling your rentals with seller financing. Because of today’s high home prices and mortgage rates, I predict you’ll discover it makes more sense to be the bank (with NO expenses like taxes, repairs or insurance) instead of being the landlord (paying ALL those expenses). I bet you’ll also realize how much more income you’ll bring in every month by seller financing instead of renting.

HERE’S WHY NOW IS THE TIME FOR SELLER FINANCING

If you’ve ever dropped a coin into a slot machine, your eyes would pop out if all the dials lined up. Well, when it comes to dropping some money on an investment, all the dials are lining up on seller financing—especially in regions of the country where rents have dropped significantly. Here are some of the factors we’re seeing in today’s market:

• RENTAL HOUSE AFFORDABILITY The cost of buying a potential rental house is the highest since at least 1996. If you get a mortgage around 8%, and pay an inflated price due to the pandemic, you’ll pay 60% more than buying the same house three years ago. This makes it very challenging to scale up your rental business. On the other hand, if you sell your rental houses now with seller financing, you’ll get substantially more than three years ago. And you’ll be getting double or triple the interest now than you would have gotten three years ago.

• INCREASES IN RENT ARE WAY BELOW INCREASES IN PRICE Averaging all US markets together, the cost of buying a house is up 60%, but rents have risen only 22% during the same 3-year period. In many markets (mainly in the western half of the country), rents have declined since last year.

• SOFTER DEMAND FOR RENTAL PROPERTIES A glut of newly built apartments is depressing rent growth. And according to the St. Louis Federal Reserve, an additional one million units currently under construction will hit the market soon. Fannie Mae predicts vacancy rates in multifamily buildings will reach 6.25% in 2024, which exceeds the 15-year average of 5.8%. Apartment stocks are underperforming. To avoid vacancies, apartments lower the rent which depresses rental income for landlords.


article continues after advertisement


• CREDIT AVAILABILITY Underwriting standards have changed drastically because of the covid pandemic. Traditional lenders arenow hurting from over two million delinquent home loans. Money from banks and mortgage companies has gotten tighter and tighter, putting eager buyers—even ones with steady jobs and solid credit—in the penalty box. The mortgage credit availability index stood at 96.3 in October, 2023; which is about half what it was three years ago. Well-qualified homebuyers are getting turned down by traditional lenders; driving them right into the arms of seller financing.

HOME APPRECIATION HAS LEVELED OFF Even though home prices shot up during the pandemic, prices aren’t maintaining the same trajectory. They’ve hit a plateau. Goldman Sachs expects home prices and mortgage rates to increase only 1.7% in the next year. That’s not just flat, that’s “stand on a brick and see fifty miles flat.” Now’s the time to sell your rental portfolio at top dollar and cash out before home prices stagnate.

TAX ADVANTAGES When you sell a rental property that has greatly appreciated, you’ll owe a bundle in capital gains taxes. But if you take the profit over time through seller financing, the Internal Revenue Service allows you to spread out the gains using the “Installment Sales Method.” This technique has allowed countless sellers to pay no capital gains taxes at all. Of course, there’s always the possibility the IRS could close this loophole in the future, so better take advantage of it now.

YOU CAN MAKE MORE THAN DOUBLE THE MONTHLY INCOME FROM SELLER FINANCING THAN LANDLORDING

Today’s home prices and interest rates are both elevated. So when you sell your rental with seller financing, the monthly mortgage payment you receive will be much larger than your monthly rent check.

In the rental world, there’s the “50% Rule” (also what they call “The Magic Number”). It means 50% of rental income goes toward expenses. If the rent checks you get don’t surpass the 50% Rule—after paying taxes, repairs, and insurance—you’ll lose money. But as a note owner in today’s market—who DOESN’T pay taxes, repairs, and insurance—even a mediocre note would easily beat the 50% Rule of profitability. And with today’s high interest rates being paid TO you instead of BY you, the checks you get every month could be lots more than you get from rent.

GET YOUR APPRECIATION NOW INSTEAD OF YEARS FROM NOW

A frequent objection people raise when they compare note investing to landlording is that when you own a rental house, the property appreciates over time. It’s a fair question that deserves a fair answer.

As long as the rental property is kept in good repair, and the neighborhood doesn’t decline, its value should increase over the years until you decide to sell it. But let’s say there are two investors; one buys a rental property, the other buys a note, and both pay the same amount. Over ten years, the note investor makes double the monthly income compared to the landlord who pays taxes, insurance, and repairs for ten years. If the landlord sells the property after ten years, he gets the appreciation—but the rent checks stop (unless he sells with seller financing). As for the note investor, after ten years he still has twenty more years of payments coming!

Even if the landlord’s rental house appreciates roughly 10% a year, fire up your calculator and you’ll see how much more the note investor makes over the life of their investments.

THEN THERE’S THE HEADACHE FACTOR

Lots of landlords think they’re getting an investment, but it turns into a job. You have to deal with showings, repairs, and midnight calls from tenants to fix a leaky hot water heater. But when you own the note, repairs are the homeowner’s headaches. Every investor who has transitioned from landlording to seller financing will agree: You can own a thousand notes for the same amount of work as owning a hundred rentals.

If the note investor’s homeowner stops paying, your investment is completely collateralized by the property. But if the landlord’s tenant stops paying, good luck collecting the back rent.

ARE YOU READY TO TURN THE CORNER ON YOUR CAREER?

It’s been said that “Timing is to investments what location is to real estate.” The time is now and the door is wide open for you to consider selling your rental properties with seller financed notes. Don’t keep doing things the same way as always, and don’t look past this tremendous window of opportunity to boost your net worth like never before.

Learning the tools of seller financing and note creation will open up a whole new world of monthly cashflow and wealth-building—and we make it surprisingly easy at NoteSchool. The first step is to take my free 2-hour Master Class where you’ll be introduced to the lucrative world of notes. Just visit: NoteSchool.com/EddieMasterClass


Eddie Speed: Author, Teacher, Innovator, Visionary

Eddie grew up around horses, but in 1980 he learned there’s more wealth to be built with a pencil than a rope. That’s when his father-in-law, a pioneer of seller financed notes, taught him the ropes of the note business. Eddie has been perfecting his craft ever since, introducing creative innovations that changed the way note investing is done.

As the nation’s most experienced note buyer, he has closed over 50,000 note deals. He launched NoteSchool in 2000, where anyone can learn the art of creative financing for performing and non-performing discounted mortgage notes. He is the owner and president of Colonial Funding Group LLC, which acquires and brokers discounted real estate secured notes, and he’s a principal in a family of Private Equity funds that acquire bulk note portfolios.

Thousands of NoteSchool students have testified to the wealth building, life-changing power of his tried-and-true, data-driven approach to note investing.


Learn live and in real-time with Realty411. Be sure to register for our next virtual and in-person events. For all the details, please visit Realty411Expo.com or our Eventbrite landing pageCLICK HERE.

The Rise of Non-Performing Loans and Opportunity for Investors

By Edward Brown

It is no surprise that mortgage rates have dramatically increased over the past year. In July 2022, 30-year fixed rates for both conforming and high-balance loans had reached 5.375%, according to sources such as Guaranteed Rate. This is up from the low 2% range in early 2021. Obviously, such an increase in rates can have a dramatic effect on house prices as would-be buyers try to buy a house they can afford.


article continues after advertisement


However, the rise in interest rates goes far beyond just what buyers can afford for a new purchase. First, adjustable-rate mortgages will climb dramatically, which will impact homeowners trying to make sure they keep up with their mortgages by not going into default. Next, the whole reason the Fed increased rates was to stave off even more inflation than the country had been experiencing since the change in presidency. Here is where we might see a rise in non-performing loans [NPLs], as homeowners fight to keep up with inflation as well as rising interest rates that impact mortgages and other borrowings [credit cards, auto loans, etc.].

During The Great Recession, the U.S. saw a huge wave of defaults with mortgages; primarily, this was due to a credit bubble, as lenders were too eager to make loans. Very little oversight was seen regarding these loans, and borrowers who should not have been granted loans still qualified. Fast forward 15 years, real estate prices have increased substantially to overcome the devastation of the previous drop.

Banks, thanks to Dodd-Frank, are now only allowed to make loans to borrowers who can demonstrate an ability to repay. All of this makes for a strong real estate market, and we should not experience the wave of foreclosures we previously saw; however, that does not mean we will not see them.

As noted above, when there is a spike in interest rates [and inflation] as we have recently experienced [and potentially more increases to come], homeowners can get behind in their mortgages, and without the government moratoriums that were in place during Covid, banks will have to start foreclosing, or sell off mortgages to keep within Federal guidelines of Reserve Requirements. The banks may try and work modifications or other remedies to assist homeowners, but there are times when there is not much the bank can do except file notices of default and start the foreclosure proceedings.


article continues after advertisement


One major difference in today’s real estate world as compared to The Great Recession is that, today, many homeowners have ample equity in their houses. This gives the homeowner the possibility of preserving some equity by selling their house rather than get foreclosed on. However, many homeowners around the country, mostly in the lower end market, will still lose their house in foreclosure. One reason is that the homeowner has not researched the value of their house; they just assume that if they cannot pay, they lose the house. Another is that some homeowners are headstrong about staying in their house and trying to fight a legal battle only to be on the wrong end and, by that time, it is too late to try and save their equity. These situations are unfortunate, as, even when the lender points these things out, many borrowers stick their head in the sand and let the chips fall where they may.

Investors have been clamoring for yield. So much so that even NPLs were commanding unheard of prices [as much as 85% of face value]. As the economy was doing well [pre-Covid], real estate prices were steadily increasing and there was confidence in the marketplace. However, in “normal” times, one might offer 50% +/- of the face of the NPL note, as there is a fair amount of work that goes into managing a NPL regarding foreclosure, forbearance, modifications, bankruptcies, and possible lawsuits by the borrowers. As interest rates rise and the supply of NPLs is sure to increase, one should expect the prices of the NPLs to decrease – – allowing investors to potentially pick up handsome profits.

In the early 1990s, the S&L crisis provided such opportunities to investors swooping up “bad loans”, as the S&Ls were directed to unload these mortgages into the market very quickly. As the dust settled, as it usually does after wide pendulum swings, these investors profited, as they picked up loans [or property if the foreclosure had already been completed, and the bank held the asset as an REO] at discounts that were previously only imaginable. Discounts of more than 60% were not uncommon. At such a discounted price, the investor appeared to not take any undue risk. There was so much room for error, almost any loan to be purchased was worth it.

We may not be in that same situation now due to restrictive banking regulations that have been imposed on banks for years, prohibiting them from making unreasonably risky loans and the fact that real estate has held its own since The Great Recession, but there should be plenty of opportunity for investors to pick up discounted loans with fairly large margins built in; however, the average investor is prohibited from participating in buying these loans due to the relatively large amount of capital needed to enter this space. For example, a large bank or hedge fund willing to unload NPLs may require a buyer to invest a minimum of $1,000,000 or more. If there is a bidding situation [auction], a refundable deposit is usually required, so the bank/hedge fund knows they are dealing with serious, wealthy buyers.

For those investors who have the wherewithal to participate in purchasing NPLs, they should have a sophisticated team to assist them, as there will be a need for analysts to do a deep dive in the values of the property to which the loans are secured, contractors to help facilitate potential rehabbing of the property if/when the property reverts to the investor, legal analysts dealing with the various foreclosure laws in the states where the properties are located, and good real estate sales people to not only give BPOs — but also help facilitate the eventual sale of the property or assist with the possible rental of the same [or find a good management company].

One strategy to consider is to approach the NPL borrower and try to re-write or modify the loan [of course, before doing so, consult with competent legal counsel to make sure that there are no legal issues that would compromise the collateral]. There are a few benefits to this strategy; first, turning a NPL into a performing loan brings immediate cash flow. Because of the discount that is obtained in the purchase, the new note holder has the flexibility of making the note more attractive for the borrower. For instance, if a note [that has a face value of $100,000] has 20 years to go and has a note rate of 6% was purchased for 60 cents on the dollar from the bank, the new note holder could offer to lower the balance to $90,000 and reduce the interest rate to 5% and have a great asset that can either be held for cash flow or sold in the secondary market.

One additional factor that may help in modifying the NPL’s notes is the fact that, according to Bank of America’s internal data, rents continue to rise. July 2022 year over year showed an increase in rents of 7.4%. Most people want to keep their home. If the lender can give them advantages to saving it, most homeowners will jump at the chance, especially when their alternative is to be thrown into a rising rent market. A question the lender has to contemplate is whether the strategy of keeping a homeowner in their home makes economic sense [ignoring the moral issue of eviction]. In some cases, evicting a homeowner and immediately selling the house may make sense.

In some cases, the lender may choose to invest money in rehabbing the property in hopes of additional gain, but there is uncertainty with this strategy; the time it takes to rehab, the expense, and the value of the house after rehab and time to sell [with expenses associated with the sale]. When a homeowner is going to get foreclosed on, there are avenues that can be taken to delay the inevitable, including filing bankruptcy. Due to court budgets, this delay may be prolonged more than the lender originally anticipated, especially in judicial-only states.

The time and expense for entering into foreclosure for the lender may not be worth the anticipated profit; however, the strategy of keeping the homeowner in place and working out a new deal can produce immediate cash flow, as the borrower will start making payments right away. In addition, the costs to modify a note are substantially less than what foreclosure costs would normally be.

The good news from the lender’s point of view is that, due to the purchase of these loans at steep discounts, rates of returns in excess of 15% are not uncommon. After the note is modified, the lender has the option to flip the note to a note buyer as a performing note [which will command a higher price than an NPL], or the lender may choose to keep the note for the cash flow. In the case of choosing to sell the note, the lender may be wise in waiting to experience six months of performance by the borrower, as most note holders desire to see notes that have at least six months’ seasoning; otherwise, they may discount the note for uncertainty reasons [lack of history] more than the lender desires.


MEET EDWARD BROWN

Edward Brown currently hosts two radio shows, The Best of Investing and Sports Econ 101. He is also in the Investor Relations department for Pacific Private Money, a private real estate lending company. Edward has published many articles in various financial magazines as well as been an expert on CNN, in addition to appearing as an expert witness and consultant in cases involving investments and analysis of financial statements and tax returns.

Edward Brown, Host
The Best of Investing on KDOW AM1220 on Saturdays at noon.


Learn live and in real-time with Realty411. Be sure to register for our next virtual and in-person events. For all the details, please visit Realty411Expo.com or our Eventbrite landing pageCLICK HERE.FacebookTwitterShare

Have Home Prices Peaked Yet?

By Rick Tobin

Since 2019, the median price of a U.S. home has increased by more than $100,000. Last month, the median home price nationwide reached an all-time record high in spite of skyrocketing mortgage rates. How is this possible?

Inflation-adjusted home prices are now 85% above their historical average dating all the way back to 1890. Additionally, inflation-adjusted home prices are now 20% above the 2008 peak, according to Case-Shiller and Reventure. The 2008 peak highs for home values were followed by almost five years of home price declines through 2013 in many regions.

Even after accounting for inflation which has severely weakened the purchasing power of one dollar ($1) from back when the Federal Reserve opened for business in 1913 to just 2 or 3 cents today, home prices have never been this unaffordable.

Home Payment-to-Median Income Rates

The home payment as a percentage of median income calculation is used to quickly determine how affordable or unaffordable the monthly payments are for each homeowner. Many years ago, it was quite common for owners to pay just 25% to 35% of their monthly gross income towards their monthly mortgage payment. Now, it’s almost double those numbers (50% to 70% of the gross income) as home prices and mortgage rates continue to rise together.

The median home payment as a percentage of median income ratio nationwide is now near 49% or 50%. This is gross or pre-tax income, so the home price-to-net income after taxes paid is much higher. This is especially true in areas with high state income tax rates like those found in California, Hawaii, New Jersey, Oregon, Minnesota, New York, Vermont, Iowa, and Wisconsin.


article continues after advertisement


Home Payment as Percentage of Median Income by State:

1. Hawaii: 68%
2. California: 67%
3. Montana: 57%
4. Oregon: 55%
5. Washington: 54%
6. Massachusetts: 53%
7. Idaho: 52%
8. New York: 51%
9. New Jersey: 50%
10. Vermont: 50%
11. Maine: 50%
12. Colorado: 49%
13. Florida: 49%
14. Rhode Island: 49%
15. Arizona: 48%

To simplify these calculations using $10,000 gross income for a household (married couple earning $5,000 each before federal or state income tax), a 68% home payment as a percentage of median income in the priciest state of Hawaii would mean that the total monthly mortgage payment (principal, interest, property taxes, homeowners insurance, and homeowners association payments if applicable) would equal $6,800 per month ($6,800 monthly mortgage payment/$10,000 household income = 68%).

Unsustainable Home Price-to-Household Income Ratios

The home price-to-household income ratio (P/E) is a quick mathematical formula that we can closely look at to determine how affordable average prices homes are for one or more metropolitan regions. Because home values in California are the highest in the nation, our homes tend to have double-digit P/E ratios compared with other states with much lower P/E ratios somewhere within the 4x to 7x range (or home prices are 4 to 7 times the household income). 5.3x is the latest median home price-to-household income ratio calculation.

Let’s put these P/E ratios to work for us to better understand how unaffordable homes have become across the nation. A newly married couple earns $80,000 per year with their combined salaries. As per the national average of 5.3x, this couple would likely pay close to $424,000 (5.3 times the applicants’ household income = the average home price or $80,000 household income x 5.3 = $424,000).

By comparison, the P/E ratios for California metropolitan regions are as follows:

* Riverside: 10.5x (or times)
* Los Angeles: 14.0x
* Santa Rosa: 14.0x
* San Diego: 14.3x
* San Francisco: 14.6x
* San Jose: 16.2x
* San Luis Obispo: 17.6x
* Santa Cruz: 20.0x

Now, let’s look at Santa Cruz, California where the home price-to-earnings ratio is 20 times the household income. If we used the same $80,000 household income as before, the average home price there would be 20 times the household income average ($80,000 household income x 20 = $1,600,000 home price).

Key points: Homeowners are paying almost double the national home price-to-household income average in Riverside, California region (10.5x vs. 5.3x) and almost four times the national P/E average in Santa Cruz, California (20.0x vs. 5.3x).

A 99% Unaffordable Rate for Homes

The typical American individual or family today cannot afford to purchase a new or older home, according to the most common mortgage lending standards such as FICO credit scores, debt-to-income (DTI) ratios, and cash reserves for loan qualification purposes.

In fact, a recently published report shared by the ATTOM real estate data company named the U.S. Home Affordability Report for the third-quarter of 2023 found median-priced single-family homes and condominiums are less affordable in 99% of counties across the nation compared to historical averages. The analysis found that the home prices were beyond the reach of the vast majority of average income earners who earned just over $71,200 per year.

With average and median home prices reaching all-time record highs in possibly 99% of regions and mortgage rates hitting 23-year highs, this combination has made home purchases less affordable than ever before.

A Shaky Small Business Sector

Historically, consumer spending has represented upwards of 70% of the total GDP (Gross Domestic Product) for the US economy. With credit card balances recently surpassing $1 trillion dollars and average annual rates hitting 28.1% per Forbes, it will directly impact both in-person and online shopping.

A whopping 53% of an estimated 40,000 surveyed small business owners responded that they are only making half or less of what they were earning prior to the pandemic declaration back in March 2020, as per Alignable. For businesses that are one to three years old, 60% of respondents said that they were earning half or less of what they were earning just one year ago.

The same Alignable survey also found that 40% of small business owners could not pay their rent in full or on time for September.

Some of the factors mentioned for declining business income were as follows:

  • 50% of the small business owners surveyed said that the 18 months of rising interest rates have cut into their profit margins. Many small business owners are paying high double-digit rates for their business operations that make today’s 30-year fixed mortgage rates seem much more affordable by comparison.
  • 52% of surveyed business owners said that they were paying more for rent now than just six months ago, with 14% of respondents claiming that their rent jumped by 20% or higher.
  • 46% of business owners said that the higher-than-usual gas prices have slowed down their business growth as an increasing number of people are buying products online partly to save gas money.

article continues after advertisement


The implosion of the retail sector continues onward, sadly. The previous six years in a row (2017, 2018, 2019, 202, 2021, and 2022) each shattered the all-time retail space closings per square foot in US history. Please note that e-commerce (online retail sales for Amazon, Walmart, and thousands of other small, medium, or larger online sites) only represented the following percentages as compared to total retail sales nationwide as per Statista:

  • 10.4% of total annual retail sales were online in 2017;
  • 12.2% of total annual retail sales were online in 2018;
  • 13.8% of total annual retail sales were online in 2019;
  • 17.8% of total annual retail sales were ecommerce in 2020;
  • 18.9% of total annual retail sales were ecommerce in 2021; and
  • 18.9% of total annual retail sales were ecommerce in 2022.

According to the U.S. Small Business Association (SBA) and the U.S. Chamber of Commerce, small businesses of 500 employees or fewer make up over 99% of all U.S. businesses. For many Americans, they think that Walmart, Amazon, and Target are the primary business operators who employ a very high percentage of Americans. While it is true that their size and market dominance continues to rapidly increase, the small business sector is the “heart and soul” of the U.S. economy.

Any loss of income for employers and their current or former employees who were laid off will eventually have a significant impact on home values for purchase and for lease. Loss of income is usually the #1 reason why a homeowner is in a distressed mortgage payment situation (forbearance, loan modification, foreclosure, or short sale). It doesn’t matter too much if the homeowner has a 2% or 3% fixed rate mortgage in place if they don’t have any income to make the payments.

Underwater Cars & All-Time Record Payments

The average car loan balance in the U.S. as of the 1st quarter of 2023 was 125% loan-to-value (LTV), as per TransUnion. Many of us remember underwater or upside-down homes following the previous economic bubble burst during the 2008 to 2013 years when the mortgage debt exceeded the current home value. Now, it’s becoming increasingly common to see underwater cars with increasingly unaffordable payments.

The average new car price today is about $48,000. The average new car payment is $750 per month and the average used car payment is $551 per month. The average new car rate is 9.48% and the average used car rate reached an all-time record high of 14%.

  • 1 out of every 3 cars are 30+ days late
  • 1 out of every 5 cars are 60+ days late
  • 1 out of every 7 cars are 90+ days late
  • Moody’s forecasts 10% auto loan delinquencies by 2024.
  • Upwards of 20,000 cars are being repossessed for nonpayment every single day nationwide.

A former Ford CEO recently said that a borrower may need to earn $100,000/yr. to qualify for a new car. The United Auto Workers union just went on strike demanding more pay and fewer work week hours as the auto sector is imploding.

The 7-Year to 10-Year Housing Bubble

The common link between less affordable payment options for homes, cars, and business operations is due to the Federal Reserve’s aggressive interest rate hike campaign which began in early 2022. Things may improve for the overall economy if and when the Federal Reserve suddenly pivots or changes direction and starts slashing rates again to stimulate the economy.

Historically, our housing and economic cycles tend to last somewhere between seven and 10 years. Almost all housing boom and bust cycles are directly related to the available supply of money that’s either affordable or not. When rates are near historic lows like we’ve seen for most of the past 10 years, then home prices are more likely to rise.

Conversely, rising rates eventually may cause home prices to stagnate or fall. Yet, we may not see home prices fall for months or years depending upon the available supply of homes and the demand for housing.

In past housing cycles when the Federal Reserve promoted aggressive rate hikes like the 17 rate increases between June 2004 and June 2006, there was a one to two year lag effect before home prices suddenly started to fall. It still took about five years for the home prices to bottom out before the Fed’s aggressive rate cuts down near 0% acted like the fuel for the biggest home appreciation cycle in U.S. history.


article continues after advertisement


Our previous housing bubble burst lasted about five years between 2008 and 2013. Today, we’re 10 years past the previous housing bottom here in 2023.

If you’re thinking about selling or refinancing (cash-out or reverse mortgages) at the potential peak of the latest housing cycle, then you might be seeing the highest peak prices sooner rather than later. If you’re thinking about buying near the bottom of the next housing downturn, then keep a close eye on unemployment numbers, home listing inventory supplies, days on market averages for home listings, distressed mortgage or foreclosure numbers, and mortgage rate directional trends.

The key to success with buying and selling real estate is partly tied to a combination of basic economics, good or bad luck, personal financial and family situations, and timing. Please keep researching as many data trends as possible so that you make the most informed decision as either a buyer, seller, landlord, or tenant to minimize your downside risks and to maximize your potential gains at the same time.


Rick Tobin

Rick Tobin has worked in the real estate, financial, investment, and writing fields for the past 30+ years. He’s held eight (8) different real estate, securities, and mortgage brokerage licenses to date and is a graduate of the University of Southern California. He provides creative residential and commercial mortgage solutions for clients across the nation. He’s also written college textbooks and real estate licensing courses in most states for the two largest real estate publishers in the nation; the oldest real estate school in California; and the first online real estate school in California. Please visit his website at Realloans.com for financing options and his new investment group at So-Cal Real Estate Investors for more details. 


Learn live and in real-time with Realty411. Be sure to register for our next virtual and in-person events. For all the details, please visit Realty411.com or our Eventbrite landing page, CLICK HERE.

Creative Financing Options

By Tod Snodgrass

https://creativetransactionfunding.com

Whether you are an experienced Real Estate Investor (REIer) or are a newbie in this industry, there exist many innovative funding techniques you can use to finance current and future deals. Generally referred to as creative financing, these terms refer to alternative or unconventional approaches that REIers may choose to utilize to acquire investment properties, using OPM: Other People’s Money.

In today’s unpredictable real estate investor landscape, it is very important to have a range of funding options at the ready before you dive into a property investment deal. Let’s face it, to be a successful REIer takes money. It does not necessarily have to be YOUR money, but before you can successfully pull off a deal, chances are SOMEONE’s funds are going to have to be brought to the table. Plan ahead. Line up funds before you need them because they have to come from somewhere.


article continues after advertisement


Make sure, before you commit to any real estate deal, that you have all your web-footed waterfowl neatly arranged in a linear fashion.

A. Lease Option: You may encounter a situation where you are not ready yet (either experience- or financial-wise) to purchase a property, either for your own personal use or as an investor. That is where the lease option can work best. Doing so provides the opportunity to purchase a property at the conclusion of a pre-arranged leasing-type agreement. This approach allows you to potentially build up equity through monthly rent payments.

The landlord benefits by earning monthly revenue. Typically, and depending on specific contract terms, a portion of the monthly rent payment is credited toward the future down payment on the house. This technique normally works best in a buyer’s market.

B. Down Payment Assistance (DPA). Many REIers are finding themselves caught in a new type of financial squeeze when it comes to the percentage of the purchase price that hard money and private lenders require that they bring to closing, i.e. “Skin-In-The-Game” (SITG) cash.

Until recently, it was possible to secure, say a 90% loan from such lenders, with the borrower required to contribute the other 10% as their SITG capital. And while those terms are still available in some cases, many REIers are waking up to a new reality: They need to bring closer to 20%-30% SITG cash to closing in terms of actual down payment money, with a general average of around 25% DP money currently required.

Upping the SITG percentage is a risk-reduction strategy employed by lenders in response to what they perceive as new uncertainties in the real estate investment marketplace, on a go-forward basis. The reality for REIers caught in this new “liquidity squeeze” is that they now may need to potentially come up with tens of thousands or even hundreds of thousands in new (SITG) investment capital above what was previously required.

Without new SITG capital, the REIer cannot close on the deal. A potential solution to this new dilemma is what we refer to as “Down Payment Assistance (equity) funding”: This is where a third party provides the needed extra SITG/DP cash in return for a modest share of the profits. See below for info about DPA.

C. Seller carryback loan. Plainly speaking, this is simply owner-provided financing. The seller acts as the lender or bank, i.e. he carries a mortgage–usually a second position loan–on the property and collects monthly payments from the buyer. Such an arrangement can be a win-win for both the buyer and the seller. Often the buyer (an REIer in this case) may be willing to pay more than the asking price in trade for advantageous loan terms on a seller carryback mortgage.

Further, the buyer is often willing to pay a higher interest rate on the seller carryback loan than the seller could earn from a CD from their local bank. Also, should the buyer default, the (previous) seller can always initiate foreclosure action and take the house back from the second position. The buyer benefits since they don’t have to go through the arduous and time-consuming chore of trying to get a bank loan; this is especially true if the buyer has a low FICO score or other credit or background issues.


article continues after advertisement


D. Buying a property “Subject-To”. What this means is that the REIer essentially takes over the seller’s remaining mortgage balance (thereby effectively “assuming the loan”) without making it official with the lender. This is a popular strategy among REIers, especially in an era of rising interest rates, since the loan being assumed probably carries a lower interest rate compared to a new (bank) loan.

Savvy REIers often employ the Subject-To method to take the place of a hard money loan. However, most REIers limit the use of Subject-To loans to relatively short-term time frames, i.e. for a few months until the REIer can either refi the loan or sell the property as part of a fix-flip strategy.

E. Hard Money: A hard money loan refers to asset-based financing where the borrower receives funds that are secured by real property. In most cases, private investors are the biggest suppliers of hard money capital, which are then funneled through hard money brokers.

While the terms (interest rate, points, time frames) of hard money loans may vary, there are several common characteristics: they are usually easier to obtain vs. a conventional bank loan; credit scores and income verification are not as important as the asset value involved; they are usually for shorter time frames (say for 6-24 months); while they charge higher interest rates, the good news is that they often can fund pretty quickly if the deal is right. They usually focus on the ARV (After Repair Value) to determine the loan terms, including important factors such as the rehab blueprints, scope of work, etc. They usually prefer to work with experienced rehabbers who have a clear plan to repay the loan within the specified time frame.

F. Cross collateral loan. This REI method assumes you already own a rental property free and clear. You want to buy another rental property. A cross collateral loan allows you to use the 100% equity in the existing property as leverage to acquire the new property you want to purchase. With cross-collateralization, the lender places a lien on both the new property and your existing property. In this way, the lender receives adequate security should you default on the loan. Basically, cross-collateralization allows you to sidestep the normal down payment requirement and/or having to take out a brand new (bank) loan.

G. Retirement accounts: Use your self-directed IRA, Roth IRA, 401-K, corporate plans as investment capital, where it is legal, prudent and appropriate to do so. Utilizing a self-directed retirement plan can empower a REIer by boosting their retirement savings, one deal at a time. Since we are talking about your retirement money, an extra degree of caution is called for. You need to possess excellent due diligence and underwriting skills in order to properly assess the potential risks involved.

H. Cash-Out Refinance. If your personal residence has a good amount of equity in it, you can unlock that equity via a cash-out refinance by tapping some of that equity. Make sure you fully understand the implications of such a loan should things not go well with your anticipated new investment. A cash-out refi may feature (more) favorable interest rates compared to a hard money loan. Also, the interest you pay is tax deductible. You need to do a risk/benefit analysis before going down this road. Regardless, if a REI deal looks very promising, and you require fast capital to make it happen, a cash-out finance can be a good way to go.

I. 203-K Loan: This unique FHA mortgage enables you to finance both the purchase (or refinancing) of a house and the cost of its rehabilitation through a single mortgage or to finance the rehabilitation of their existing home.

1. Pros:

a. Lower credit score allowed
b. Smaller down payment requirements (as low as 3.5%)
c. Can provide temporary housing while a home is being repaired
d. Lower potential interest rates, compared to similar loan types
e. Ability to combine home purchase and renovations into a single loan

f. Low down payment and credit score requirements

2. Cons:

a. FHA mortgage insurance required
b. FHA loan rates may be higher compared to conventional loans
c. Process may require meeting with a 203(k) repair consultant
d. More extensive repairs require more paperwork
e. Potential for the additional cost of architectural assessments
f. Property must be your primary residence
g. You must live in the home for 12 months before selling or renting it out

J. More creative financing methods to consider include:

1. Approach friends, relatives, etc. Options can include debt or equity.

2. Equity investors. The advantage here is that you do not have to make monthly payments because there is no loan. When the deal is done, some sort of profit split is made to compensate the investor(s).

3. Credit card advances. This can be an expensive gambit. It is only to be undertaken when you are very sure of positive, short-term outcomes. The bank may charge several points and up to 29% interest rates, so be very careful with this one.

4. Joint venture: you bring the deal, they bring the money, split the profits at the end. This is a variation on an equity-type investment.

5. Hypothecate (borrow against) a mortgage note you own. Basically, you take out a loan by pledging the note, thereby using it as collateral to secure the loan.

6. Personal asset loans: pawn some jewelry; get a car title loan, etc.

Down Payment Assistance Funding Program

Are you a Real Estate Investor Pro (REI Pro) who has a property you want to buy, with a 70% LTV or better, but you lack some of the Down Payment (DP) money needed to close the deal? You need say, 25% DP, but can only come up with 10% and need 15% more (DP money.

The good news is if your deal meets our standard criteria (70% LTV or better = 30% or more equity in the deal, etc.), CTF can provide the missing 15% in DP funding. By not having to put out all your own capital into DPs–especially if you are low on cash–you’ll be able to do more deals. With your DP source already in place, it will shorten your time for getting positive confirmation from your primary lender, and for getting more deals successfully closed.

For more information about Tod Snodgrass, please visit: https://creativetransactionfunding.com.

Thank you.

Tod Snodgrass, President
Creative Transaction Funding LLC
8322 El Paseo Grande
La Jolla, CA 92037
310 408-7015
https://creativetransactionfunding.com


Learn live and in real-time with Realty411. Be sure to register for our next virtual and in-person events. For all the details, please visit Realty411Expo.com or our Eventbrite landing page, CLICK HERE.

4 Reasons to Consider Asset-Based Lending

By Vista Capital Solutions

There are many situations in which your company may need funding. Maybe you’re looking to expand your business, open up a new location or invest in a new project. Maybe you need new equipment or training for employees. Maybe you’re anticipating a slow season and want to be financially prepared for lower revenue. Whatever the case, asset-based lending can be a great way for you to get the money that you need. There are several reasons why this might be a better option than a traditional loan.


ADVERTISEMENT


1. It Can Be Easier to Get

Asset-based lending uses collateral to secure your loan. When you are using collateral, it is less risky for a lender to provide you with funding. Because of this, aspects that might have otherwise kept you from being approved for a loan, such as limited credit history, might not be as important.

2. They May Cost Less Over Time

Because you are providing collateral, some terms of your loan might be more favorable than they would be if you had gotten a traditional loan. With this kind of lending, interest rates are often lower. This means that you will end up spending less to pay back your loan than you would with another kind of funding.

3. The Money Can Be Used Where You Need It

You might think that, when you get a loan, you can spend it however you like, but this isn’t always the case. Depending on the type of funding you get, there might be some restrictions on how you can use it. Asset-based loans are generally more flexible, allowing you to use them in a variety of different ways as long as it is for your business.


ADVERTISEMENT


4. You Can Get Funding More Quickly

Applications for traditional loans can often take a while to be approved. There are larger amounts of paperwork and stricter requirements, so the application process can be lengthy. Even if you are approved for a loan, it can still take months to receive the money. An asset-based loan, on the other hand, can be approved much more quickly.

If you are having trouble qualifying for a traditional loan, then asset-based lending is an option you may want to consider. It can be easier to get than other types of funding and comes with additional benefits, like flexibility and lower interest rates. Different lenders will have varying requirements, so look into your options to determine if it is a good fit for your business.

Learn live and in real-time with Realty411. Be sure to register for our next virtual and in-person events. For all the details, please visit Realty411Expo.com or our Eventbrite landing page, CLICK HERE.

A 33-to-1 Vacant & Distressed Home-to-Listed Home Ratio

By Rick Tobin

Why are you just searching for listed properties for sale when the number of distressed, vacant, and “shadow inventory” homes is almost 33 times larger than the national home listing inventory supply?

How is this possible with my 33 number claim? First, upwards of 16 million homes were listed as “vacant” or shadow inventory in the fourth quarter of 2022, as per the U.S. Census Bureau, National Association of Realtors (NAR), and other groups. A vacant home can be defined as a vacation home, unsold new home building inventory (near record levels of new single-family homes and multifamily apartment buildings being built in 2023), distressed or pre-foreclosure properties, or homes held by billion-dollar corporations like BlackRock, Blackstone, or State Street for the long-term that just sit there with no intent to rent it out at present.

Second, there are at least a few million distressed mortgages (FHA loans, especially) currently in forbearance agreements in order to delay the lender’s foreclosure filing actions to bring the total to more than 18.5 million properties. Frankly, I think that the number is closer to 20 million after counting VA, conforming, non-QM, and private money loans, but we’ll just focus on the 18.5 million vacant or distressed home number.

Since 1934, FHA (Federal Housing Administration) has insured more than 40 million loans nationwide. Today, a relatively high percentage of homebuyers still rely upon FHA to purchase their homes partly due to the much lower interest rates and easier loan qualification guidelines such as loan programs which allow FICO credit scores as low as 500, debt-to-income (DTI) ratios up to 50% or higher, and loan-to-value (LTV) options near 96.5% to 100% LTV.

As of March 2023, the national home listing inventory was listed at 562,565 by data provided by the Federal Reserve Economic Data and the NAR. Let’s do the math as follows:

18.5 million distressed or vacant homes / 562,565 listed homes = 32.885 times


ADVERTISEMENT


Distressed FHA Loans & Continued Forbearance Extensions

There are three to four times as many delinquent FHA mortgage loans nationwide as compared to the entire national home listing inventory with somewhere near at least a few million distressed FHA loans.

February 8, 2023: Today, the U.S. Department of Housing and Urban Development (HUD) Secretary Marcia L. Fudge announced that, thanks to Federal Housing Administration (FHA) programs, approximately 2 million homeowners with FHA mortgages were able to stay in their homes from the beginning of the COVID-19 pandemic in March 2020 through December 2022 – when doing so was often a matter of life and death. During this period of time amid the pandemic, FHA borrowers whose ability to make their mortgage payments was impaired by the pandemic were able to obtain either a COVID-19 forbearance or a more permanent solution such as a loan modification that allowed them to avoid foreclosure.
Source: HUD Secretary Announces Major Milestone of Assisting Nearly 2 Million Homeowners Stay in their Homes

With a few million distressed FHA loans that they admit to and is probably undercounted, it’s no wonder why the federal government wants to keep offering FHA forbearance extensions.

Details of FHA’s COVID-19 Forbearance

Important information about FHA’s COVID-19 Forbearance:

To be eligible for the COVID-19 Forbearance or forbearance extension in the table above, you must request this relief from your servicer on or before May 31, 2023.

You can request a FHA COVID-19 Forbearance for up to 6 months. If needed, an additional 6 month extension may be requested. If you began your initial forbearance on or after October 1, 2021, you are only eligible for the additional 6 months if your initial 6 months forbearance will be exhausted and expires on or before May 31, 2023.

Additional forbearance options may be available to you after May 31, 2023. Your mortgage servicer may provide for a temporary pause or reduce your monthly mortgage payments to allow you time to overcome your financial hardship. An extended forbearance period may be provided to you if you are unemployed and actively seeking employment.

No extra fees, penalties, or interest will be added to your account during the forbearance period.

Source: U.S. Department of Housing and Urban Development (HUD)

There are also a significant number of distressed VA and conforming or conventional loans nationwide which are held by Fannie Mae or Freddie Mac in the secondary market that aren’t really being “officially” counted with the most up to date numbers. FHA and VA mortgage loans have both consistently represented close to 10% each of the annual national funded loan market. As a result, these government-backed or insured loans, which typically average close to 0% to 3.5% down payments for FHA, VA, and conforming, are something to keep a close eye on as the economy continues to soften.

The 40-Year Loan Modification Program for FHA Borrowers

Good news: National mortgage delinquency rates dropped 15% in March 2023 while reaching 2.92%, which was a new all-time record low.

Bad news: Millions of distressed mortgages are not being counted as “delinquent” once they enter forbearance agreements with their lender (FHA loans, especially). The national FHA loan default rate reached 12% in February and will likely continue to rapidly increase. Distressed FHA and VA loan investments are some of the best deals out there because they usually have the lowest mortgage rates that you can take over by way of creative seller-financing techniques.

A forbearance agreement is when the lender or mortgage loan servicing company agrees to postpone or delay their foreclosure actions with the delinquent borrower. Sometimes, these foreclosure postponements may last months or years.

On March 8, 2023, HUD issued their Mortgagee Letter 2023-06 with details described as the “Establishment of the 40-Year Loan Modification Loss Mitigation Option” with a stated purpose noted as “This Mortgagee Letter (ML) establishes the 40-year standalone Loan Modification into FHA COVID-19 Loss Mitigation policies.”

Several mainstream media analysts mistakenly described this new 40-year loan proposal offered by FHA as a purchase loan as well. Yet, this is not correct because it’s only for the refinance of currently distressed 30-year FHA loans into longer 40-year loan terms in order to reduce the monthly payments for borrowers. There is no published word about whether FHA will later consider offering 40-year purchase loans for borrower prospects.

Housing and Family Trends

Real estate is a people business, first and foremost. The #1 most important factor for housing trends is related to population trends and household formations for families especially. Without people, there’s no need for housing regardless of the affordable financing offered.

One of the main reasons why people purchase single-family homes is because they’re trying to either build a growing family or the need to house two or three generations of the family under the same roof. You can’t spell “single-family homes” without family in it.

The U.S. has the highest percentage of one-person households in the entire world. A few years ago, one-person households surpassed all other household formations in Canada.

In 2022, only 24% of U.S. households had at least one child under the age of 18. In 1965, upwards of 42% of households had a child under the age of 18.

The Decline of Family Households

Here are some of the published data numbers from sources such as the U.S. Census Bureau, the National Center for Health Statistics (NCHS), Pew Research, and numerous other data sources in regard to individuals and family structure trends:

  • National overall divorce rate in the USA: 50%+.
  • The California divorce rate is 60%.
  • The Orange County, California divorce rate is 72%.
  • 41% of first marriages nationwide end in divorce.
  • 60% of second marriages end in divorce.
  • 73% of third marriages end in divorce.
  • The average length of a marriage in the U.S. that ends in divorce is 8 years.
  • There is one divorce every 36 seconds in the U.S. on average; 2,400 divorces per day; 16,800 divorces per week; and 800,000 to 900,000 divorces per year.
  • The percentage of American men between the ages of 20 and 39 who are now married has fallen by half (35% of men are married as of 2017) since the early 1970s (70% of men were married).
  • Unmarried parents who live together are more likely to break up than married parents, per the Brookings Institute.
  • Per the CDC in 2016 through at least 2020, U.S. fertility rates were the lowest ever recorded as fewer couples are having children these days. Each consecutive year over the past five or six years reached all-time record lows.
  • 78% of all households in the U.S. contained one married couple in 1950. Today, married households are below 48%.
  • In 2010, the Pew Research Center reported that 44% of Americans polled in the 18-to-29 year old age range believed that “marriage was becoming obsolete.”
  • Divorce rates for people over the age of 50 have doubled between 1990 and 2015, per Pew Research Center.
  • In 1956, roughly 5% of all babies were born to unwed mothers. Between 2008 and 2016, babies born to unwed mothers were closer to the 40% range.
  • Upwards of 50% of children in impoverished regions of the U.S. live in homes without fathers.
  • 46% of children live at home with a mother and father who were in their first marriage together.
  • The average American woman in 1970 had her first child at 21.4 years of age. Today, the woman is near 25.6 years of age.
  • The U.S. has the highest teen pregnancy rate in the industrialized world.
  • More than 50% of children are born to unmarried women under the age of 30.

Saving Equity or Creating Newfound Wealth

What are your options as either a homeowner with an ongoing forbearance agreement in place with your lender, a struggling business owner, a commercial property owner and landlord with incredibly high vacancy rates, or as an investor seeking new opportunities if and when the economy suddenly pivots and we enter a more clearly visible deeper recession? If home values are more likely to be higher today than later this year, is it now a good time to sell? If so, where will be your next destination for a home?

Generally, loss of income is the #1 reason why homeowners lose their homes to lenders or mortgage loan service companies in foreclosure. The #2 reason why homeowners walk away from their home is when the mortgage debt exceeds the current market value and it’s upside-down or underwater. This is when short sale options become more prevalent.


ADVERTISEMENT


The real risk associated with homes purchased in recent years is related to the relatively low down payment averages for first-time buyers and others that were leveraged between 96.5% and 100% loan-to-value at the close of escrow. Effectively, these homebuyers were upside-down with negative equity at closing when factoring in the potential 6% to 8% closing costs to resell the homes after paying real estate brokerage commissions, title, escrow or attorney’s fees, transfer taxes, third-party inspection reports, and possible seller credits towards the buyer’s closing costs.

In 2022, first-time homebuyers represented 34% of all home purchases across the nation, as per the NAR. During the fourth quarter of 2022, purchase loans comprised 78.6% of all FHA mortgages funded. With a high percentage of FHA borrowers reported as first-time homebuyers, their average down payments were likely close to 3.5% or below. What happens if home values fall 5%, 10%, or more in value over the next year?

If you’re currently in a distressed mortgage situation as a homeowner or investor or are searching for discounted off-market listings as a buyer with very creative and flexible financing solutions, I can show you effective ways to save your equity or create newfound wealth with my mortgage and investment business named Realloans (Real Estate Loans and Creative Sales) and my real estate group linked here: So-Cal Real Estate Investors.


Rick Tobin

Rick Tobin has worked in the real estate, financial, investment, and writing fields for the past 30+ years. He’s held eight (8) different real estate, securities, and mortgage brokerage licenses to date and is a graduate of the University of Southern California. He provides creative residential and commercial mortgage solutions for clients across the nation. He’s also written college textbooks and real estate licensing courses in most states for the two largest real estate publishers in the nation; the oldest real estate school in California; and the first online real estate school in California. Please visit his website at Realloans.com for financing options and his new investment group at So-Cal Real Estate Investors for more details. 


Learn live and in real-time with Realty411. Be sure to register for our next virtual and in-person events. For all the details, please visit Realty411.com or our Eventbrite landing page, CLICK HERE.