Have Home Prices Peaked Yet?
By Rick Tobin
Since 2019, the median price of a U.S. home has increased by more than $100,000. Last month, the median home price nationwide reached an all-time record high in spite of skyrocketing mortgage rates. How is this possible?
Inflation-adjusted home prices are now 85% above their historical average dating all the way back to 1890. Additionally, inflation-adjusted home prices are now 20% above the 2008 peak, according to Case-Shiller and Reventure. The 2008 peak highs for home values were followed by almost five years of home price declines through 2013 in many regions.
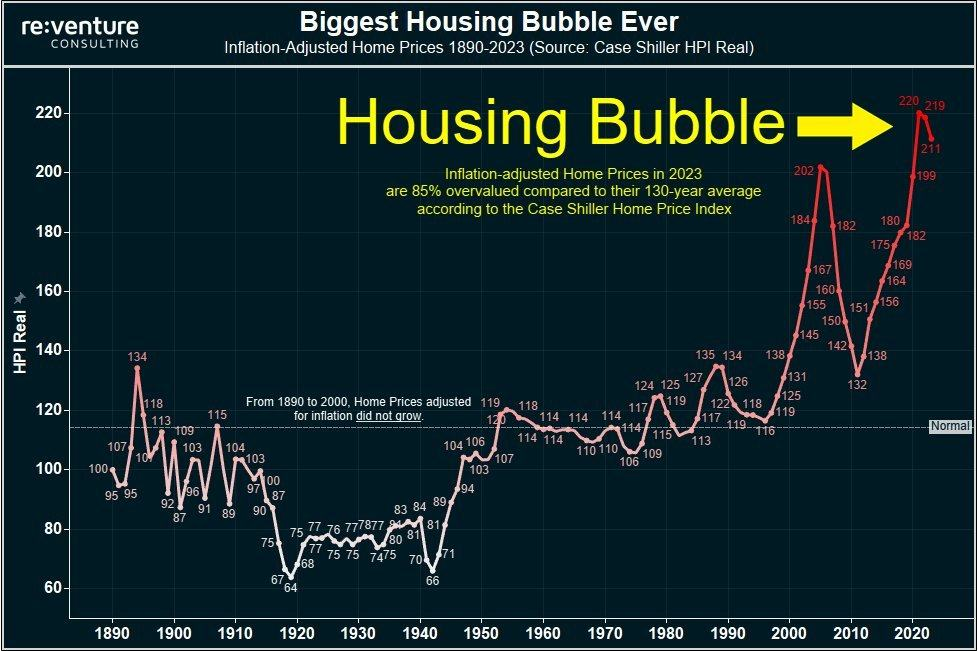
Even after accounting for inflation which has severely weakened the purchasing power of one dollar ($1) from back when the Federal Reserve opened for business in 1913 to just 2 or 3 cents today, home prices have never been this unaffordable.
Home Payment-to-Median Income Rates
The home payment as a percentage of median income calculation is used to quickly determine how affordable or unaffordable the monthly payments are for each homeowner. Many years ago, it was quite common for owners to pay just 25% to 35% of their monthly gross income towards their monthly mortgage payment. Now, it’s almost double those numbers (50% to 70% of the gross income) as home prices and mortgage rates continue to rise together.
The median home payment as a percentage of median income ratio nationwide is now near 49% or 50%. This is gross or pre-tax income, so the home price-to-net income after taxes paid is much higher. This is especially true in areas with high state income tax rates like those found in California, Hawaii, New Jersey, Oregon, Minnesota, New York, Vermont, Iowa, and Wisconsin.
article continues after advertisement

Home Payment as Percentage of Median Income by State:
1. Hawaii: 68%
2. California: 67%
3. Montana: 57%
4. Oregon: 55%
5. Washington: 54%
6. Massachusetts: 53%
7. Idaho: 52%
8. New York: 51%
9. New Jersey: 50%
10. Vermont: 50%
11. Maine: 50%
12. Colorado: 49%
13. Florida: 49%
14. Rhode Island: 49%
15. Arizona: 48%
To simplify these calculations using $10,000 gross income for a household (married couple earning $5,000 each before federal or state income tax), a 68% home payment as a percentage of median income in the priciest state of Hawaii would mean that the total monthly mortgage payment (principal, interest, property taxes, homeowners insurance, and homeowners association payments if applicable) would equal $6,800 per month ($6,800 monthly mortgage payment/$10,000 household income = 68%).
Unsustainable Home Price-to-Household Income Ratios
The home price-to-household income ratio (P/E) is a quick mathematical formula that we can closely look at to determine how affordable average prices homes are for one or more metropolitan regions. Because home values in California are the highest in the nation, our homes tend to have double-digit P/E ratios compared with other states with much lower P/E ratios somewhere within the 4x to 7x range (or home prices are 4 to 7 times the household income). 5.3x is the latest median home price-to-household income ratio calculation.
Let’s put these P/E ratios to work for us to better understand how unaffordable homes have become across the nation. A newly married couple earns $80,000 per year with their combined salaries. As per the national average of 5.3x, this couple would likely pay close to $424,000 (5.3 times the applicants’ household income = the average home price or $80,000 household income x 5.3 = $424,000).
By comparison, the P/E ratios for California metropolitan regions are as follows:

* Riverside: 10.5x (or times)
* Los Angeles: 14.0x
* Santa Rosa: 14.0x
* San Diego: 14.3x
* San Francisco: 14.6x
* San Jose: 16.2x
* San Luis Obispo: 17.6x
* Santa Cruz: 20.0x
Now, let’s look at Santa Cruz, California where the home price-to-earnings ratio is 20 times the household income. If we used the same $80,000 household income as before, the average home price there would be 20 times the household income average ($80,000 household income x 20 = $1,600,000 home price).
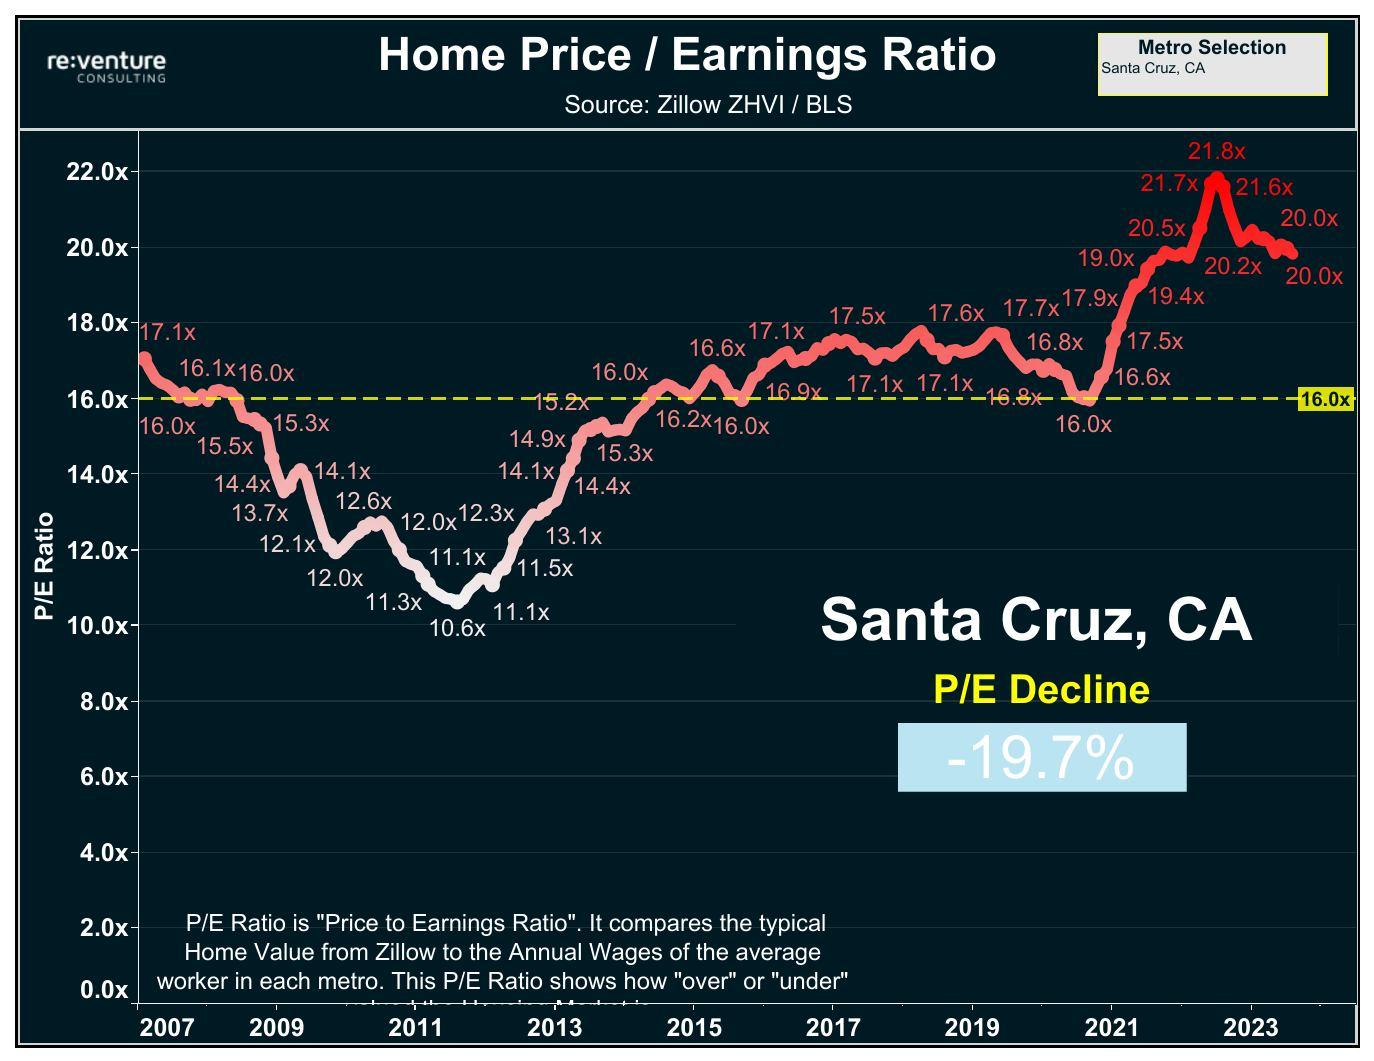
Key points: Homeowners are paying almost double the national home price-to-household income average in Riverside, California region (10.5x vs. 5.3x) and almost four times the national P/E average in Santa Cruz, California (20.0x vs. 5.3x).
A 99% Unaffordable Rate for Homes
The typical American individual or family today cannot afford to purchase a new or older home, according to the most common mortgage lending standards such as FICO credit scores, debt-to-income (DTI) ratios, and cash reserves for loan qualification purposes.
In fact, a recently published report shared by the ATTOM real estate data company named the U.S. Home Affordability Report for the third-quarter of 2023 found median-priced single-family homes and condominiums are less affordable in 99% of counties across the nation compared to historical averages. The analysis found that the home prices were beyond the reach of the vast majority of average income earners who earned just over $71,200 per year.
With average and median home prices reaching all-time record highs in possibly 99% of regions and mortgage rates hitting 23-year highs, this combination has made home purchases less affordable than ever before.
A Shaky Small Business Sector
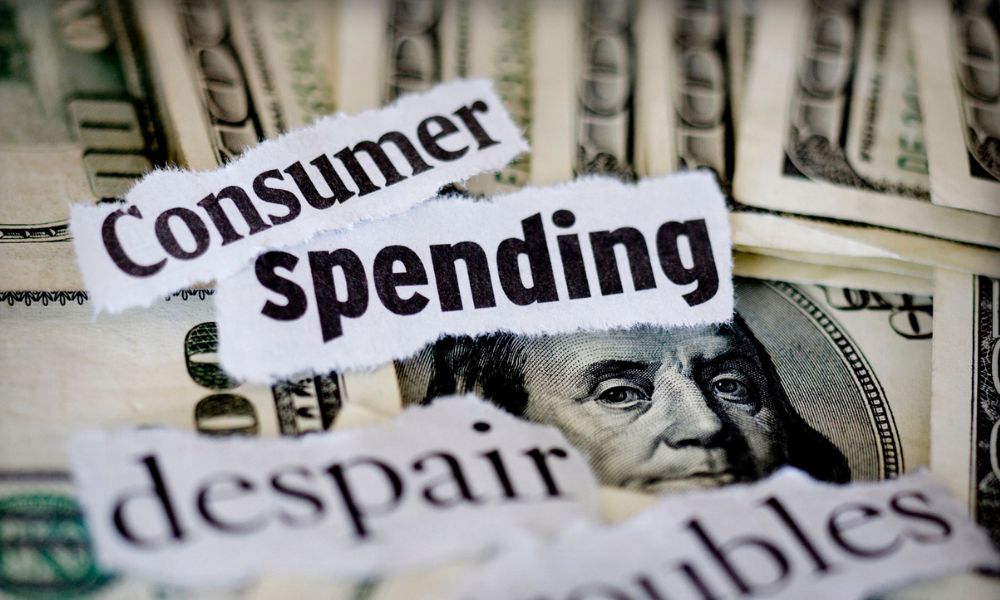
Historically, consumer spending has represented upwards of 70% of the total GDP (Gross Domestic Product) for the US economy. With credit card balances recently surpassing $1 trillion dollars and average annual rates hitting 28.1% per Forbes, it will directly impact both in-person and online shopping.
A whopping 53% of an estimated 40,000 surveyed small business owners responded that they are only making half or less of what they were earning prior to the pandemic declaration back in March 2020, as per Alignable. For businesses that are one to three years old, 60% of respondents said that they were earning half or less of what they were earning just one year ago.
The same Alignable survey also found that 40% of small business owners could not pay their rent in full or on time for September.
Some of the factors mentioned for declining business income were as follows:
- 50% of the small business owners surveyed said that the 18 months of rising interest rates have cut into their profit margins. Many small business owners are paying high double-digit rates for their business operations that make today’s 30-year fixed mortgage rates seem much more affordable by comparison.
- 52% of surveyed business owners said that they were paying more for rent now than just six months ago, with 14% of respondents claiming that their rent jumped by 20% or higher.
- 46% of business owners said that the higher-than-usual gas prices have slowed down their business growth as an increasing number of people are buying products online partly to save gas money.
article continues after advertisement

The implosion of the retail sector continues onward, sadly. The previous six years in a row (2017, 2018, 2019, 202, 2021, and 2022) each shattered the all-time retail space closings per square foot in US history. Please note that e-commerce (online retail sales for Amazon, Walmart, and thousands of other small, medium, or larger online sites) only represented the following percentages as compared to total retail sales nationwide as per Statista:
- 10.4% of total annual retail sales were online in 2017;
- 12.2% of total annual retail sales were online in 2018;
- 13.8% of total annual retail sales were online in 2019;
- 17.8% of total annual retail sales were ecommerce in 2020;
- 18.9% of total annual retail sales were ecommerce in 2021; and
- 18.9% of total annual retail sales were ecommerce in 2022.
According to the U.S. Small Business Association (SBA) and the U.S. Chamber of Commerce, small businesses of 500 employees or fewer make up over 99% of all U.S. businesses. For many Americans, they think that Walmart, Amazon, and Target are the primary business operators who employ a very high percentage of Americans. While it is true that their size and market dominance continues to rapidly increase, the small business sector is the “heart and soul” of the U.S. economy.
Any loss of income for employers and their current or former employees who were laid off will eventually have a significant impact on home values for purchase and for lease. Loss of income is usually the #1 reason why a homeowner is in a distressed mortgage payment situation (forbearance, loan modification, foreclosure, or short sale). It doesn’t matter too much if the homeowner has a 2% or 3% fixed rate mortgage in place if they don’t have any income to make the payments.
Underwater Cars & All-Time Record Payments

The average car loan balance in the U.S. as of the 1st quarter of 2023 was 125% loan-to-value (LTV), as per TransUnion. Many of us remember underwater or upside-down homes following the previous economic bubble burst during the 2008 to 2013 years when the mortgage debt exceeded the current home value. Now, it’s becoming increasingly common to see underwater cars with increasingly unaffordable payments.
The average new car price today is about $48,000. The average new car payment is $750 per month and the average used car payment is $551 per month. The average new car rate is 9.48% and the average used car rate reached an all-time record high of 14%.
- 1 out of every 3 cars are 30+ days late
- 1 out of every 5 cars are 60+ days late
- 1 out of every 7 cars are 90+ days late
- Moody’s forecasts 10% auto loan delinquencies by 2024.
- Upwards of 20,000 cars are being repossessed for nonpayment every single day nationwide.
A former Ford CEO recently said that a borrower may need to earn $100,000/yr. to qualify for a new car. The United Auto Workers union just went on strike demanding more pay and fewer work week hours as the auto sector is imploding.
The 7-Year to 10-Year Housing Bubble
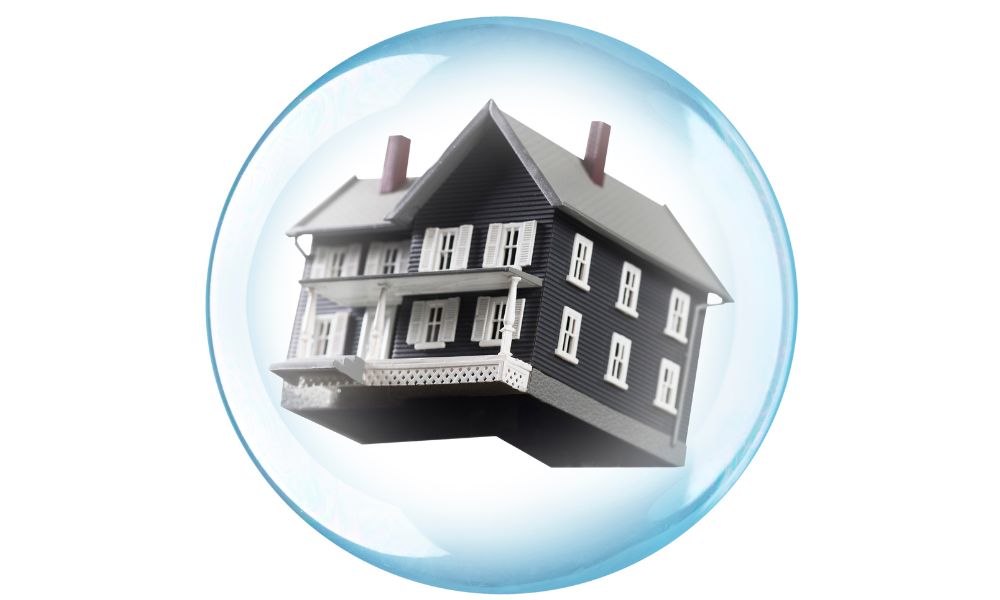
The common link between less affordable payment options for homes, cars, and business operations is due to the Federal Reserve’s aggressive interest rate hike campaign which began in early 2022. Things may improve for the overall economy if and when the Federal Reserve suddenly pivots or changes direction and starts slashing rates again to stimulate the economy.
Historically, our housing and economic cycles tend to last somewhere between seven and 10 years. Almost all housing boom and bust cycles are directly related to the available supply of money that’s either affordable or not. When rates are near historic lows like we’ve seen for most of the past 10 years, then home prices are more likely to rise.
Conversely, rising rates eventually may cause home prices to stagnate or fall. Yet, we may not see home prices fall for months or years depending upon the available supply of homes and the demand for housing.
In past housing cycles when the Federal Reserve promoted aggressive rate hikes like the 17 rate increases between June 2004 and June 2006, there was a one to two year lag effect before home prices suddenly started to fall. It still took about five years for the home prices to bottom out before the Fed’s aggressive rate cuts down near 0% acted like the fuel for the biggest home appreciation cycle in U.S. history.
article continues after advertisement

Our previous housing bubble burst lasted about five years between 2008 and 2013. Today, we’re 10 years past the previous housing bottom here in 2023.
If you’re thinking about selling or refinancing (cash-out or reverse mortgages) at the potential peak of the latest housing cycle, then you might be seeing the highest peak prices sooner rather than later. If you’re thinking about buying near the bottom of the next housing downturn, then keep a close eye on unemployment numbers, home listing inventory supplies, days on market averages for home listings, distressed mortgage or foreclosure numbers, and mortgage rate directional trends.
The key to success with buying and selling real estate is partly tied to a combination of basic economics, good or bad luck, personal financial and family situations, and timing. Please keep researching as many data trends as possible so that you make the most informed decision as either a buyer, seller, landlord, or tenant to minimize your downside risks and to maximize your potential gains at the same time.

Rick Tobin
Rick Tobin has worked in the real estate, financial, investment, and writing fields for the past 30+ years. He’s held eight (8) different real estate, securities, and mortgage brokerage licenses to date and is a graduate of the University of Southern California. He provides creative residential and commercial mortgage solutions for clients across the nation. He’s also written college textbooks and real estate licensing courses in most states for the two largest real estate publishers in the nation; the oldest real estate school in California; and the first online real estate school in California. Please visit his website at Realloans.com for financing options and his new investment group at So-Cal Real Estate Investors for more details.
Learn live and in real-time with Realty411. Be sure to register for our next virtual and in-person events. For all the details, please visit Realty411.com or our Eventbrite landing page, CLICK HERE.