Posts

Southern California’s Historic Housing Boom: Canyon Lake & Long Beach Spotlights

By Rick Tobin

Did you know that approximately 25 million people, or 63% of California’s 40 million residents, live in the 10 counties located in Southern California (San Luis Obispo, Kern, Santa Barbara, Ventura, Los Angeles, Orange, San Diego, Riverside, San Bernardino, and Imperial)?

San Bernardino County is the largest county in the nation by land size that spans over 20,100 square miles. Los Angeles County is the most populous county in the nation, with more than 10 million residents.

There are few places more beautiful in the entire world than the Southern California region. It’s been said that the three most important factors that cause home prices to rise are due to “location, location, and location.” California’s historic price boom over the past 55+ years is more proof why as it will be shared next with more details.


The Extreme Dollar & California Home Seesaw Ride

As the dollar’s purchasing power falls, home values tend to rise. Most of the dollar’s decline in value took place during the 55-year time period that followed President Nixon’s removal of the dollar from the gold standard starting in 1971.

The purchasing power of the dollar has fallen by -87% between 1971 and 2026. $100 in 1971 fell to an equivalent purchasing power in these years: 1981 ($45), 1991 ($30), 2001 ($23), 2011 ($18), 2021 ($15), and 2026 ($13). What you could purchase for $100 in 1971 is now similar to what you can buy for $13 in 2026.

Because real estate is an exceptional hedge against inflation and an imploding dollar somewhat like an inverse seesaw, California median home prices increased by a whopping +3,361% during the same time period between 1971 and 2026.
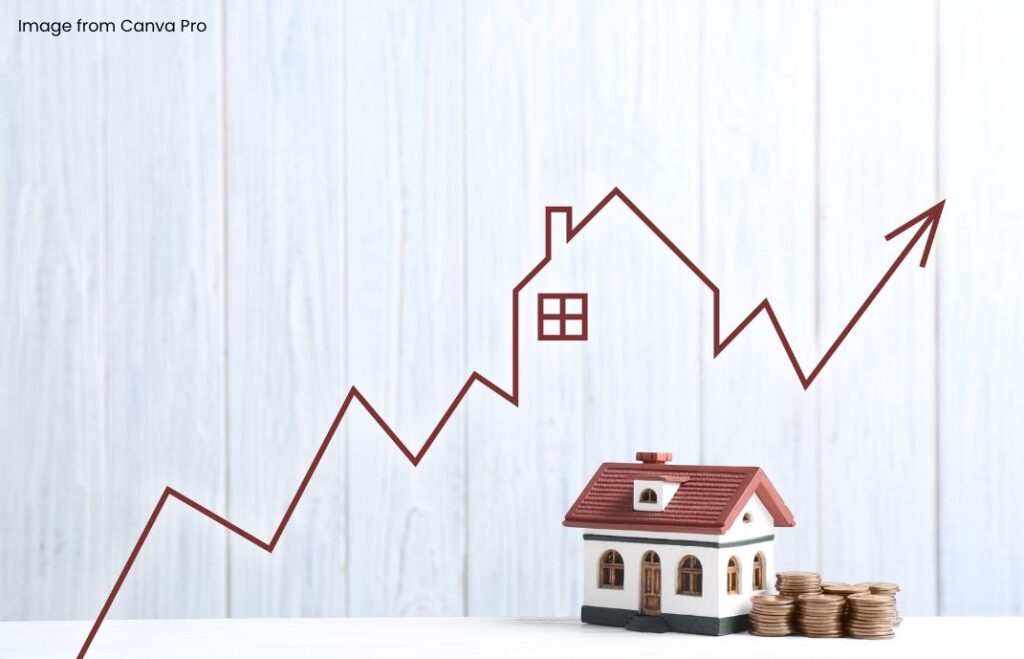
By Q2 2026, the statewide California median single-family home price reached $930,260, as per various sources like CAR (California Association of Realtors) and NBC. When compared to the historical statewide median price of $26,880 in 1971, California home prices rose a staggering +3,361% higher, while representing a home price increase of about $903,380.

To put these numbers into better perspective, if you adjust 1971’s home prices for cumulative national inflation over the same time period, which is roughly 833%, a comparable home would’ve cost somewhere between $250,000 and $270,000 today. Yet, the actual appreciation of California home prices far outpaces general inflation at a pace of 2,528% higher (3,361% – 833%) between 1971 and 2026.

As such, California truly is the “Golden State” in more ways than one.

California’s Safer Gated Communities

California and Florida were the two states that created the master-planned home communities behind gates starting with the Temple Terrace, Florida community, which was America’s first master-planned golf course community built in 1925. Shortly thereafter, Rancho Santa Fe in San Diego County followed in 1927 here in Southern California.

Gated golf course communities were later truly perfected in Riverside County, California out in the Greater Palm Springs or Coachella Valley region starting with the opening of the Thunderbird County Club in Rancho Mirage in 1951.

Did you know the popular Ford Thunderbird car was named after this country club because the Ford Chairman at the time named Ernest Breech was a golf club member? Thunderbird Country Club was also the credited birthplace of another form of transportation called the motorized golf cart.

Famous celebrity residents and members at Thunderbird included Lucille Ball and Desi Arnaz, Bing Crosby, Bob Hope, Frank Sinatra, Dean Martin, Clark Gable, Gerald and Betty Ford, and Perry Como.

Later, gated communities were built all across Coachella Valley that were designed around golf courses, tennis courts, and small lakes.

Both celebrities and non-celebrities began to truly appreciate the privacy and feelings of safety that gated communities offered them.


California’s Very Few Gated Cities

Most gated communities are just very large HOAs (Homeowners Association) or POAs (Property Owners Association filled with homes and vacant lots) instead of actual separately gated cities. However, there are a few exceptions to this rule.

Technically, there may only be three gated cities in California as follows:

1. Canyon Lake (Riverside County): It’s the largest gated California city, right between Lake Elsinore and Menifee, with their own beautiful lake, golf course, fire department, and soon-to-be brand-new police department that’s scheduled to open up for business in August 2026, following their ribbon-cutting event on Friday, July 31st at 4 pm PST at the Canyon Lake Towne Center.

2. Hidden Hills (Los Angeles County): An entirely gated, incorporated city in the Santa Monica Mountains that’s best known for horse trails, lack of streetlights, and celebrity residents.

3. Rolling Hills (Los Angeles County): It’s located on the beautiful Palos Verdes Peninsula, just north of Long Beach and San Pedro. Every single property there is zoned as a ranch with mandatory horse trails.

Other regions often mistaken as “gated cities” include Coto de Caza in Orange County, which is technically a Census-Designated Place (CDP) rather than an incorporated gated city, and Bradbury Estates in Los Angeles County that’s partially gated.

Because many coastal Southern California homes are priced in the millions, a larger number of residents are moving to the Inland Empire (Western Riverside County, especially) instead of packing up and moving out of state hundreds or thousands of miles away from family and friends. To learn more details, this is a very interesting 8-minute video: Why Everyone is Moving to the Inland Empire.

So-Cal City Spotlight: Canyon Lake (“A Bit of Paradise”)

Source: Canyon Lake Insider

Let’s first learn why Canyon Lake is attracting so many new residents and businesses from the President and CEO of the Canyon Lake Chamber of Commerce named Johnny Pineda:

“Canyon Lake continues to stand out as one of Southern California’s most desirable communities because it offers far more than beautiful homes, it offers an exceptional lifestyle. Buyers are drawn to its private lake, resort-style amenities, strong sense of community, and convenient access to surrounding employment centers, making it an attractive place to live, invest, and raise a family.

For business owners, Canyon Lake provides a loyal, engaged customer base and a Chamber of Commerce committed to fostering economic growth through meaningful partnerships and community involvement. It’s a community where quality of life and long-term value go hand in hand.”

The Origins and Evolution of Canyon Lake

Canyon Lake was first established back in 1968. The original architect for Canyon Lake designed it after my old hometown of Huntington Harbour.

Lots could be purchased as low as $5,000 to $10,000 as my family knows firsthand because my father purchased a $5,000 lot so that we could pull our ski boat from Huntington Beach to Canyon Lake and water ski there.

Let’s take a closer look at how this region grew in size over the past 58 years:

* Late 1960s to 1970s (Development): The Kaiser Land Development Company began developing and marketing the area as a country estate and recreational destination. Vacant lots started to sell at prices between $14,000 to $25,000 during the 1970s and beyond.

* 1980s to 1990s (Growth): As both the I-15 highway corridor and Inland Empire expanded, Canyon Lake transformed from a vacation destination into a primary commuter hub. By the mid-to-late 1980s, single-family homes were selling somewhere within the $130,000 to $230,000 price range.

* The 2000s Boom & Crash: Home values really started to appreciate in Canyon Lake just like most of the rest of California between 2002 and 2006 or 2007 near the previous housing market peak. The median home price broke the $300,000 mark by 2003 and later peaked near $425,000 in 2005. Subsequent to the housing bust meltdown following 2008, prices fell nearly 50% back into the $200,000 price range by 2009 to 2011. California home prices fell -41.7% from peak-to-trough between 2008 and 2012, so Canyon Lake’s losses were worse than median statewide losses.

* 2012 – 2019 (Recovery): The housing market began to stabilize before later shooting skyward throughout the 2010s years. By 2018, the Canyon Lake median home sales price reached almost $414,000.

* 2020 – 2026 (Pandemic & Record Low Rate Surge): Home prices began to really increase as more coastal Southern California residents, who could no longer afford multi-million dollar fixer uppers by the beach, discovered Canyon Lake and moved out here in large numbers. Canyon Lake median home prices fluctuated between $750,000 and to more than $900,000. Some new home listing prices today for large waterfront homes are in the $4 to $5 million dollar price range.

Canyon Lake effectively offers affordable waterfront living in Riverside County that’s within a 1-hour to 1.5-hour driving distance for residents to places like Huntington Beach, Newport Beach, Laguna Beach, Los Angeles, San Diego, and to the Palm Springs region east of Canyon Lake.

Canyon Lake was just ranked #2 on the 8 Best Lake Towns in the U.S. for Retirees list in June 2026 by Travel and Leisure.

The adjacent Canyon Hills master-planned community, which first broke ground in 2001, is another very nice community that has almost the same number of 11,000 to 12,000 residents as Canyon Lake.

While being more affordable than Canyon Lake and located in the city of Lake Elsinore (largest freshwater lake in Southern California), most of the Canyon Hills homes are newer and development continues onward to this day. Canyon Hills has also been the fastest-growing home development community in Riverside County over the past 25 years.

On the other side of Canyon Lake is the city of Menifee with upwards of 125,000 residents, which was just ranked as the only “boom town” located in Southern California by SmartAsset because of their +29% growth rate over the past five years.

Thanks to the old real estate theory known as the principle of progression, the higher-priced waterfront homes in Canyon Lake are helping the adjacent home values in Canyon Hills and Menifee move higher due to being so close to this prime location with multi-million dollar homes.

For more details about the latest real estate trends in these three booming regions, please follow my Facebook page entitled Real Estate Insights for Canyon Lake, Menifee, and Lake Elsinore.

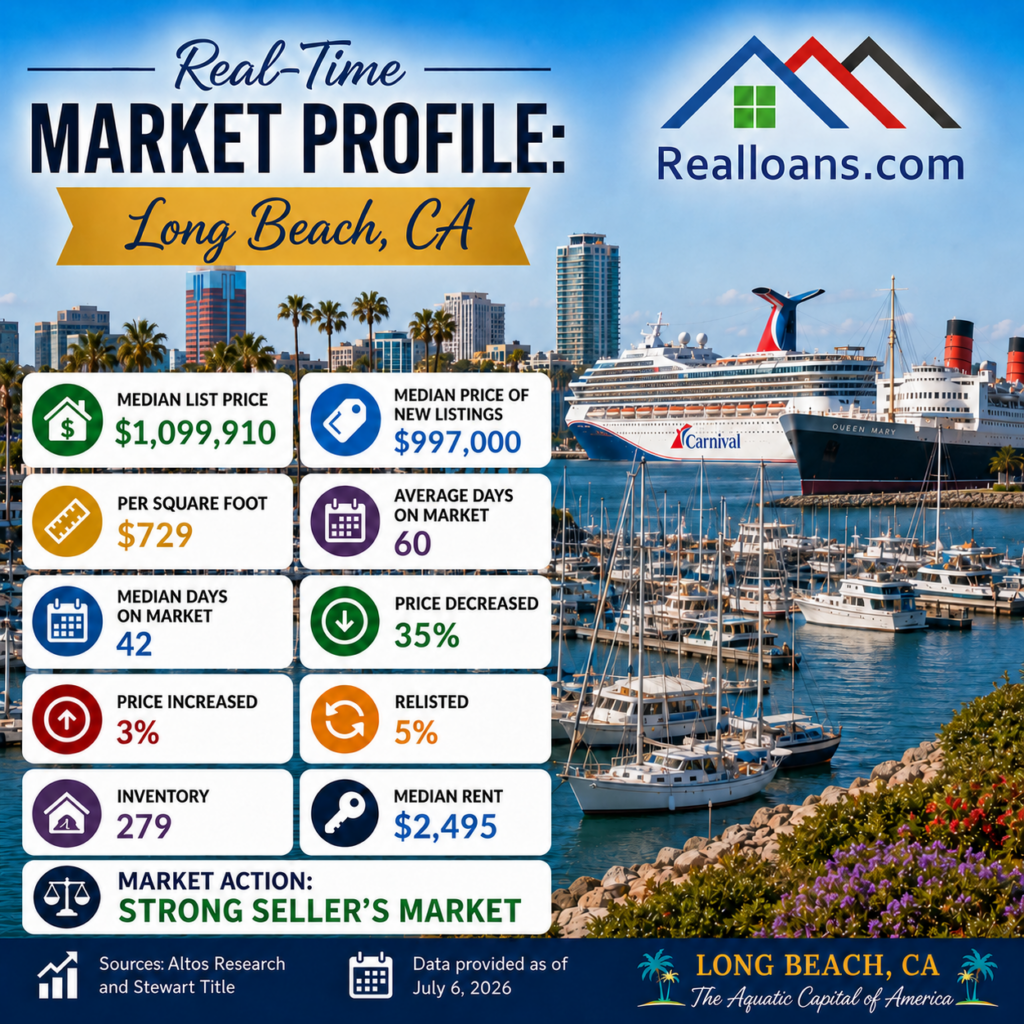
So-Cal City Spotlight: Long Beach (“Aquatic Capital of America”)

Could Long Beach be considered as the most “affordable unaffordable beach city” in Southern California? How can this seemingly contradictory “affordable unaffordable” oxymoron be true at the exact same time?

Let’s take a closer look at the amazing city of Long Beach:

The Top 4 Most Unaffordable Housing Regions in the World

The Top 4 Least Affordable Housing Regions in the World (home price-to-household income ratio) are all located in California:

1. San Jose
2. Los Angeles
3. Long Beach (2nd largest city in Los Angeles County after the City of Los Angeles and 7th largest in the state)
4. San Diego
Source: Remitly

The Top 7 largest California cities are: 1. Los Angeles, 2. San Diego, 3. San Jose, 4. San Francisco, 5. Fresno, 6. Sacramento, and 7. Long Beach.

The most densely-populated area in America is in the Los Angeles-Long Beach-Anaheim metropolitan region, with more than 13 million residents.

Long Beach’s Household Income

While Long Beach is one of the most beautiful regions in the world with a very diverse economy, their home prices are somewhat reasonable as compared with nearby coastal regions in Seal Beach, Huntington Beach, Newport Beach, and Palos Verdes.

This is partly because the median household income range in Long Beach is somewhere within the $87,000 to $91,000 range for one, two, or more worker occupants in the same household.

This is a core reason why Long Beach was listed as the #3 most unaffordable housing regions in the entire world on a home price-to-household income ratio basis.

Long Beach and San Pedro (both described as the Port of Los Angeles) are the shipping port capitals here in America. In early 2026, Long Beach processed more shipped goods than any other port in North America.

Long Beach will host at least 11 different sporting events in 2028 when the Los Angeles Olympics takes place. As a result, new construction continues onward at a rapid pace with venues such as the Long Beach Amphitheater (largest waterfront venue on the West Coast with an 11,000 person capacity) that just opened in June 2026, which is right adjacent to the historic Queen Mary ship.
Quality of Life, Prime Locations, and Massive Home Price Gains

Southern California residents benefit from living in one of the most scenic locations on the planet, right adjacent to the world’s largest body of water called the Pacific Ocean. Yet, they also can grab their snow skis or snowboards and drive up to Big Bear Mountain in San Bernardino County on the same day when they surfed a wave earlier in the morning by the Huntington Beach Pier.

Some of the most amazing golf courses in the nation are located in Southern California, especially in the Newport Coast at Pelican Hills, Torrey Pines in La Jolla, Riviera Country Club in Pacific Palisades, Canyon Lake Golf & Country Club, or at more than 100 different golf courses in the Coachella Valley (Palm Springs, Palm Desert, Rancho Mirage, La Quinta, etc.).

I’m not sure that any other home region in America had a better +3,361% home price gain between 1971 and 2026 than Southern California. Even if there were a region with a more impressive home price percentage gain, it’s highly doubtful that their year-round climate and quality of life were better than in Southern California.

To learn more details about the benefits of living and investing in Southern California, please join my So-Cal Real Estate Club where we primarily meet in Canyon Lake, Long Beach, and online.


Rick Tobin has worked in the real estate, financial, investment, and writing fields for the past 30+ years. He’s held eight (8) different real estate, securities, and mortgage brokerage licenses to date and is a graduate of the University of Southern California.

Rick provides creative residential and commercial mortgage solutions for clients across the nation. He’s also written college textbooks and real estate licensing courses in most states for the two largest real estate publishers in the nation; the oldest real estate school in California; and the first online real estate school in California.

Please visit his website at Realloans.com for financing options, join his investment group at So-Cal Real Estate Investors, and follow his new So-Cal Real Estate TV channel for more details.


Rick Tobin
Realloans (Real Estate Loans)
https://realloans.com/
Phone or Text: (760) 485 – 2422
NMLS 1934868
Equal Housing Opportunity / Equal Housing Lender
To quickly apply online: Loan Application
For our real estate course: Learn Real Estate

Please follow our new real estate channel (watch on television, computers, and phones): So-Cal Real Estate TV

Our Facebook business pages: Realloans, Inside Los Angeles, Inside Pacific Palisades, Inside Long Beach, Inside Huntington Beach, Inside Orange County, Inside La Jolla, Inside San Diego, Inside Lake Elsinore, Inside Temecula Valley, Inside Coachella Valley, and So-Cal Real Estate Investors.

Here are some of my articles: The Fall of 2025 and Rise of New Opportunities, The Intersection of Declining Home Sales and Creative Marketing, Are Lower Rates on the Horizon?, Weather Extremes, Homes, and Insurance Risks, The California Gold Rush Boom, and Are You Focused on Commercial Real Estate?

Please join my So-Cal Real Estate Investors group that meets at Canyon Lake Golf & Country Club, Shoreline Yacht Club in Long Beach, and online: So-Cal Real Estate Investors.


Are You Interested in Learning About Tax Sales? Join Ken Letourneau “The Tax Sale Master” Tomorrow

Hello Friends,

We hope you are having a blessed Sunday. We thank you for being a part of our Realty411 network where our mission is to provide life-changing REI knowledge. With this in mind, we would like to invite you to a new virtual educational session with Ken Letourneau, known as “The Tax Sale Master”.

Ken has spoken at our Realty411 events in California and we want to make sure our national network has access to his incredible knowledge. Investors, be sure to join his webinar to increase your knowledge about Tax Sales across the nation.

NEW CLASS: June 8, 2026 – 6 pm PT, 7 pm MT, 8 pm CT, 9 pm ET

REGISTER HERE

Ken Letourneau known as “The Tax Sale Master”

For the past 15 years, Ken Letourneau, known as “The Tax Sale Master”, has specialized in the niche market of purchasing properties through local government tax sales, also known as tax sale investing. This strategy has attracted major Wall Street firms like BlackRock and JPMorgan Chase due to its lucrative potential.

With tax sale investing, you can earn returns of up to 25% on your money or even acquire properties for as little as $1,000.

Ken Letourneau is a seasoned real estate professional with over 25 years of experience in the industry. He has specialized in tax lien certificates and tax deed properties and is actively participating in tax sales auctions across the United States.

Ken’s expertise extends beyond his personal ventures. He now dedicates a significant portion of his time to educating others in the intricacies of tax sales auctions. Be sure to register for his free training.

Attend a Live Online Tax Auction Training With Ken Letourneau, The Tax Sale Master

  • 6pm PT | 7pm MT | 8pm CT | 9pm ET
  • 100% Online | FREE to Attend | Limited Seats

NEW CLASS: June 8, 2026 – 6 pm PT, 7 pm MT, 8 pm CT, 9 pm ET

Analyzing the Sideways Housing Market Shift

By Rick Tobin

The housing market in many regions across the nation can be best described as “sideways” where home prices remain relatively stable and listing inventory is still well below historical averages.

While housing trends are more localized and can vary from a stronger sellers’ market to a better buyers’ market depending on the region, we’re seeing sideways types of stable home price trends in many regions that fluctuate within a more narrow price range swing. It’s not an obvious appreciating or booming price trend or a downward, busting, or depreciating price movement.

Whether your local housing market region has a balanced market supply of buyers and sellers or many more sellers than buyers, home listing prices aren’t drastically falling on a large scale as of yet.

For any type of product or service, an equalized number of buyers and sellers is usually more positive than negative to at least keep the prices relatively stable or flat.


Our Unusual Sideways Housing Market

I describe average price trends in most regions as “flat” in spite of so many historic negative housing and economic trends that would’ve acted like a figurative anchor in previous housing cycles and pulled home values back down. If so, it would’ve created more “underwater” properties where the mortgage debt exceeded the current home market value.

Let’s take a closer look at sideways types of housing market characteristics:

Flat home prices: A more typical home price trend for a sideways housing market is when home prices remain flat or stagnant, partly since the number of buyers and sellers is more balanced. However, home prices are either flat or slowly appreciating in spite of the record imbalance of sellers vs. buyers.

An inverted housing market: We’re not seeing home prices crashing like they did during the 2008 to 2012 era at this point in today’s housing cycle. Nationally, there were an estimated 1.99 million sellers competing for approximately 1.48 million buyers, as per Fortune and Redfin in Q1 of 2026.

The whopping number of an all-time record 630,000 more home sellers than buyers should’ve created a much stronger buyer’s market as home listing price averages should’ve trended downward. However, we’re still not seeing that happen on a large scale in more regions.

Doubling Home Listing Numbers: You’ve probably noticed the national home listing supply numbers moving up over the past year from a low near one million to almost two million today.

What’s a bit confusing is that many of these national home listing supply numbers just focus on older existing-homes for sale, while not including the near record number of new builder homes for sale as well.

Average new U.S. home prices from motivated builders continue to remain priced below older existing homes for sale. This price trend differential is highly unusual because buyers used to willingly pay an average of 15% higher for new homes due to the obvious benefits of brand new appliances, roof, windows, plumbing features, and lengthy home warranty plans.

After combining the older and brand new home listings, this number gets closer to two million. However, it’s still about half as large as the four million home listings for sale back near the previous housing bubble peak in 2007.

As I’ve shared for many years, the number of distressed (forbearance, loan modifications, pre-foreclosures, etc.) and vacant “shadow inventory” supply of homes absolutely dwarfs the national home listing inventory supply by a significant number.

After this huge number of distressed properties, which may have delinquent mortgages that haven’t been paid for several years, later turns into foreclosures and future listings, then median home prices are likely to remain stagnant or start falling.

A positive population trend that I’ve shared before is that there are now 40 million people living here in the U.S. today than there were back in 2007 when national home listing inventories peaked near 4 million homes for sale. However, how many of these additional 40 million people living in the U.S. can qualify to purchase a home or lease a property?

Older Buyers and Sellers, Fewer Families

Adults between the ages of 61 and 79 continue to dominate the U.S. housing market and represent the largest group of home buyers and sellers, according to the National Association of REALTORS®’ newly released 2026 Home Buyers and Sellers Generational Trends report.

Baby Boomers (born between 1946 and 1964) accounted for 42% of all U.S. home buyers and 55% of home sellers, according to this NAR report. First-time home buyers fell to their lowest share on the NAR’s records that date back to 1981, comprising just 21% of all home buyers.

The average first-time U.S. homebuyer age in 2025 was 40 years of age. Sadly, the average first-time homebuyer age in California last year was closer to an all-time record high of 49. If a California buyer takes out a 30-year mortgage and doesn’t pay any extra principal payments, then they will be 79 years of age by the time their home is free-and-clear with no debt.

In 2025, there were more home buyers across the nation over the age of 70 than under the age of 35. Last year, the average U.S. home seller was 64 years of age.

Both marital and fertility trends are near historic lows as fewer people are truly in love or financially secure enough to get married and have children. Raising children from birth until just the age of 18 in today’s America can cost an average of $300,000, as per CBS News.

The number #1 cause of divorce these days is not related to a spouse being unfaithful. No, it’s related more to financial pressures. Ironically, the top 2 reasons for financial insolvency these days are tied to unpaid medical bills and divorce.

Unhappy relationships and feelings of disconnection among the younger generations will eventually be a major factor causing declining future single-family home sales, especially if they don’t have any loving family members living with them.

Mortgage Rates and Record Debt

Those new record low 3% mortgage rates are long gone. Yet, today’s rates that are swinging from the low-to-high 6% rate range for many applicants are still well below the 50-year historical average for 30-year fixed mortgage rates that are closer to 7.76%.

A major difference today for many people is the fact that our dollar’s purchase power keeps falling at a rapid pace. This is painfully obvious for many of us who go grocery shopping.

A prime example of how bad food prices have gotten is the fact that a recent LendingTree survey found that nearly one-in-three Americans are using Buy Now, Pay Later type of costly installment plan services to buy groceries.

The average new car payment is nearly $775 per month, while some new truck payments can be in the $2,000 to $3,000 per month range. Gas prices here in California are more likely to be above $6 per gallon than below that figure. Car insurance and maintenance costs keep rising as well. As a result, it may cost a car owner an average of closer to $1,500 per month (car payment, gas, insurance, maintenance, etc.) or more to keep driving their car.

Total unpaid credit card debt reached a new record high in Q1 2026 at nearly $1.25 trillion dollars. With APRs (Annual Percentage Rate) for many rates and fees somewhere within the 28% to 40% APR range, it’s becoming incredibly challenging to pay off consumer debt.

Buying and Selling Timing Options

It’s been said that the three most important factors for real estate are “location, location, and location.” While this may be true for prime coastal beachfront properties in Southern California like those found in Huntington Harbour, Newport Beach, and Laguna Beach, I would add market timing as the fourth most important factor.

How often do we look back and clearly see that the housing market was peaking or busting? With 20/20 hindsight today, it’s much easier to see the positive or negative housing trends in the past.

What’s more important is to pay close attention to the positive or negative trends in your housing market regions of interest today!

If this perceived flat or stagnant housing market suddenly turns into a downward home price cycle, then you as a buyer will have less competition to purchase discounted properties that interest you.

For sellers in a declining housing market with a record imbalance of sellers-to-buyers, you will need to seriously consider reducing your home listing prices instead of waiting and holding out for all-time record price highs for your neighborhood.


Please closely watch the average Days on Market (DOM) for your region to have a better understanding of home value trends. An increasingly longer number of active days for sale is more likely to lead to future home price drops rather than price hikes.

For savvy real estate investors who closely follow Realty411, if you’re the only active investor in your region interested in a distressed property that may or may not be currently listed for sale, you might boost your nest egg by purchasing well below market value and holding on to it for the long run.

As many of us know, real estate has proven to be an exceptional hedge against inflation. Our dollar will continue to keep weakening and inflation will keep rising each year more often than not. As a result, property values may keep rising as well in spite of a potentially weakening economy.


Rick Tobin has worked in the real estate, financial, investment, and writing fields for the past 30+ years. He’s held eight (8) different real estate, securities, and mortgage brokerage licenses to date and is a graduate of the University of Southern California.

Rick provides creative residential and commercial mortgage solutions for clients across the nation. He’s also written college textbooks and real estate licensing courses in most states for the two largest real estate publishers in the nation; the oldest real estate school in California; and the first online real estate school in California.

Please visit his website at Realloans.com for financing options, join his investment group at So-Cal Real Estate Investors, and follow his new So-Cal Real Estate TV channel for more details.


Rick Tobin
Realloans (Real Estate Loans)
https://realloans.com/
Phone or Text: (760) 485 – 2422
NMLS 1934868
Equal Housing Opportunity / Equal Housing Lender
To quickly apply online: Loan Application
For our real estate course: Learn Real Estate

Please follow our new real estate channel (watch on television, computers, and phones): So-Cal Real Estate TV

Our Facebook business pages: Realloans, Inside Los Angeles, Inside Pacific Palisades, Inside Long Beach, Inside Huntington Beach, Inside Orange County, Inside La Jolla, Inside San Diego, Inside Lake Elsinore, Inside Temecula Valley, Inside Coachella Valley, and So-Cal Real Estate Investors.

Here are some of my articles: The Fall of 2025 and Rise of New Opportunities, The Intersection of Declining Home Sales and Creative Marketing, Are Lower Rates on the Horizon?, Weather Extremes, Homes, and Insurance Risks, The California Gold Rush Boom, and Are You Focused on Commercial Real Estate?

Please join my So-Cal Real Estate Investors group that meets at Canyon Lake Golf & Country Club, Shoreline Yacht Club in Long Beach, and online: So-Cal Real Estate Investors.

Understanding Risks of Affiliate In-House Brokerage Referrals or Kickbacks

By Rick Tobin

In today’s world, there are seemingly monopolies growing in almost every field where a product or service is offered. If so, it’s the consumer who ends up paying more money due to less competition.

Whether it’s one, two, three, five, or 10 companies or corporations controlling the market share for products or services like soda drinks, electric cars, electricity, AI technologies, ice cream, banking, or real estate, the declining number of competition for many of these mega-corporations worth billions or trillions can keep the prices higher than normal for consumers.

As most of us see firsthand on a daily basis, inflation rages onward as the dollar’s purchasing power keeps declining, and the prices paid for products or services skyrockets. Who doesn’t want to pay less money for a product or service instead of seeing corporations create more record profits?


Increasing Litigation Concerns for Employers and Agents

We’re starting to see more and more lawsuits filed across the nation that are making similar claims about unfair monopoly-like control of various product or service sectors. Additionally, there are anti-steering violation allegations being made that may include the same in-house real estate brokerage ownership of affiliate companies that are also financially benefitting, while consumers are paying higher costs as a result.

For example, this recent lawsuit filed against Rocket Mortgage by the law firm Hagens Berman on behalf of numerous consumers focuses on potential anti-steering and kickback violations with larger lenders, brokerage firms, and their third-party affiliates. One core claim made in this lawsuit was that Rocket was possibly paying referrals to agents for buyer mortgage applicants in exchange for steering them towards Rocket.

Hagens Berman, which also represented home sellers in a class-action lawsuit against the National Association of Realtors that alleged real estate brokerage companies were conspiring to inflate real estate commissions and later settled in 2024 for $418 million, has yet to prove anything in court against Rocket as of this publication date. In a court of law, one is innocent until later proven guilty or the case settles out of court.

There are other lawsuits out there being filed against real estate brokerage firms, insurance offices, and other companies that are making claims that the client’s best interests aren’t being protected because they may be paying much higher mortgage rates and fees that are split amongst the affiliate businesses under the same corporate ownership interests.

If the parent company is named as a defendant in a lawsuit, the odds are quite high that the employed individual real estate agent who worked directly with the unhappy client will be named in the costly lawsuit as well.

Anti-Steering Risks and In-House Affiliates

Anti-steering laws, primarily under the Truth-in-Lending Act (TILA/Regulation Z) and the Dodd-Frank Act, prohibit mortgage originators from steering borrowers towards loans with less favorable terms to gain higher compensation or profits. Brokers are required to present loan options with the lowest interest rate, points, and fees that are the safest for their borrower clients.

If you can visualize someone “steering” in a car, or leading them by a figurative hand, to an affiliate third-party lender owned by their same employing broker, while knowing that the rates and fees are generally higher than nearby independent mortgage brokers, this is an easy way to simplify it.

Let’s take a closer look at Reg Z regulations:

From the Federal Reserve’s website:
Regulation Z: Loan Originator Compensation and Steering

“The Truth in Lending Act

The Truth in Lending Act (TILA) is implemented by the Board’s Regulation Z (12 CFR Part 226). A principal purpose of TILA is to promote the informed use of consumer credit by requiring disclosures about its terms and cost. TILA also includes substantive protections. For example, the act and regulation give consumers the right to cancel certain credit transactions that involve a lien on a consumer’s principal dwelling.

Regulation Z also prohibits specific acts and practices in connection with an extension of credit secured by a consumer’s dwelling.

Prohibitions related to mortgage originator compensation and steering

Regulation Z prohibits certain practices relating to payments made to compensate mortgage brokers and other loan originators. The goal of the amendments is to protect consumers in the mortgage market from unfair practices involving compensation paid to loan originators.

The prohibitions related to mortgage originator compensation and steering apply to closed-end consumer loans secured by a dwelling or real property that includes a dwelling.”

Anti-Discrimination Claims

Now, let’s focus on how potential monopolies and the control of in-house third-party services in sectors like the real estate, insurance, and mortgage fields can drive prices higher for consumers in spite of the potential violation of RESPA, the Fair Housing Act, the Sherman Anti-Trust Act of 1890, and other federal and state regulations.

To simplify for the Fair Housing Act (Federal Fair Housing Act of 1968), it originated as part of the Civil Rights Act (Title VIII). This Act prohibits discrimination in the sale, rental, financing, or housing based on race, color, religion, gender, national origin, familial status, or disability.

As per the Fair Housing Act, the higher charging of rates or fees for real estate commissions, mortgage brokerage fees, insurance, or other third-party affiliate services offered by the same parent umbrella-like corporation can be alleged by some to be discriminatory as well as fraudulent.

As I’ve shared before, I’ve written numerous real estate licensing courses in most states as well as college textbooks for the two largest real estate publishers in the nation as well as for the oldest and best-known real estate school in California.

Lawsuits filed that allege the violation of discrimination can later lead to millions of dollars’ worth of future courtroom judgments. It’s very wise to research any potential state or federal violation risks associated with referring a client to an affiliate business, while profiting at the same time with undisclosed financial gains, in order to minimize your financial and legal risks.

I’ve often asked for many years the following question, “How do so many large real estate brokerage offices own and control affiliate in-house mortgage, escrow (a key description is usually “independent” and “neutral”), insurance, and/or inspection businesses and not potentially violate various anti-monopoly or anti-steering laws?”

RESPA and Kickbacks

It’s unlawful for a licensed real estate, insurance, or mortgage professional to receive profits or referrals from a transaction that aren’t fully disclosed in writing and shared with the client. These hidden “kickbacks” or undisclosed profits can later be used in a lawsuit and also put someone’s professional license at risk for being suspended or revoked.

Here is how the National Association of Realtors describes RESPA:
What is the Real Estate Settlement Procedures Act (RESPA)?

The Real Estate Settlement Procedures Act (RESPA) provides consumers with improved disclosures of settlement costs and to reduce the costs of closing by the elimination of referral fees and kickbacks.

RESPA was signed into law in December 1974, and became effective on June 20, 1975. The law has gone through a number of changes and amendments since then, all with the intent of informing consumers of their settlement costs and prohibiting kickbacks that can increase the cost of obtaining a mortgage.

RESPA covers loans secured with a mortgage placed on one-to-four family residential properties.”

Monopolies Harm Consumers

The more competition there is from numerous businesses offering similar products or services, the more likely that the prices will be lower and better for consumers.

A monopoly may exist when a single company or corporation has exclusive control over a product or service in a market region with minimal competition, partly due to their actions that make it more challenging for customers to seek out other products or services. If so, this allows the business to charge much higher prices because of the perceived limited access to other product or service choices.

After the passage of the Sherman Anti-Trust Act of 1890, it gave more power to the federal government to bring legal action against trusts or other entities that were declared “in restraint of trade or commerce among the several states, or with foreign nations.” Initially, this law was passed to slow down JP Morgan and John D. Rockefeller’s consolidation of wealth by way of multiple industry monopolies across the nation.

The merging of more and more large brokerage and financial companies across the nation seems to be creating an increasing number of monopolies in these fields. How is this truly fair and in a clients’ best interests to have fewer choices, while paying higher costs?

Duties and Clients’ Best Interests

Licensed real estate professionals owe their clients certain fiduciary duties or legal obligations to act in their clients’ best interests. Many times, these fiduciary duties owned by a real estate agent to their clients can be summarized by the acronym OLDCAR as follows:

Obedience: Carrying out all lawful instructions requested by the client.

Loyalty: Placing the client’s interests above all others, including the agent’s own.

Disclosure: Revealing all known or potential risks such as property defects, outdoor environmental concerns, competing offers, or agent relationships with others.

Confidentiality: Keeping client information, such as financial information or motivation, confidential, even after the relationship ends.

Accounting: Safeguarding and reporting all money or documents entrusted to the agent.

Reasonable Care and Diligence: Acting with skill, care, and diligence in order to protect the client.

If an agent knows that rates and fees charged for in-house mortgages, insurance, or other services are higher than other nearby services offered by independent companies, this seems to not closely follow the “acting in the client’s best interest” mantra or duty owed.


The Benefits of Smaller Mortgage Companies

Here are some key points where smaller independent mortgage brokers may be the best choice for buyers, sellers, and advising real estate agents:

● Overhead costs are much lower for small mortgage shops. For some larger corporate real estate brokerage firms, they may be faced with hundreds of thousands to millions of dollars’ worth of monthly expenses that they must cover from multiple revenue streams related to all of their third-party affiliates.
● Because the monthly overhead costs are lower for small mortgage shops, many of them can afford to offer the lowest rates and fees to their borrowers.
● Small mortgage shops typically move much quicker than larger retail mortgage lenders and can close loans in two weeks or less.
● Smaller mortgage shops usually have much more experienced mortgage brokers working there with upwards of decades’ worth of experience. Anyone who can survive the ups and downs or the mortgage brokerage world for more than five or 10 years must be doing something right.
● Experienced and independent mortgage brokers are more likely to have purchased real estate themselves and can be much more helpful advising their clients and agents through the closing process.

When in doubt as it relates to your clients, please remember to “disclose, disclose, and disclose” all of your financial interests and potential profits as well as truly act in your clients’ best interests by referring them to your most trusted and affordable mortgage brokers or other third-parties.


Rick Tobin

Rick Tobin has worked in the real estate, financial, investment, and writing fields for the past 30+ years. He’s held eight (8) different real estate, securities, and mortgage brokerage licenses to date and is a graduate of the University of Southern California.

Rick provides creative residential and commercial mortgage solutions for clients across the nation. He’s also written college textbooks and real estate licensing courses in most states for the two largest real estate publishers in the nation; the oldest real estate school in California; and the first online real estate school in California.

Please visit his website at Realloans.com for financing options, join his investment group at So-Cal Real Estate Investors, and follow his new So-Cal Real Estate TV channel for more details.


Rick Tobin
Realloans (Real Estate Loans)
https://realloans.com/
Phone or Text: (760) 485 – 2422
NMLS 1934868
Equal Housing Opportunity / Equal Housing Lender
To quickly apply online: Loan Application
For our real estate course: Learn Real Estate

Please follow our new real estate channel (watch on television, computers, and phones): So-Cal Real Estate TV

Our Facebook business pages: Realloans, Inside Los Angeles, Inside Pacific Palisades, Inside Long Beach, Inside Huntington Beach, Inside Orange County, Inside La Jolla, Inside San Diego, Inside Lake Elsinore, Inside Temecula Valley, Inside Coachella Valley, and So-Cal Real Estate Investors.

Here are some of my articles: The Fall of 2025 and Rise of New Opportunities, The Intersection of Declining Home Sales and Creative Marketing, Are Lower Rates on the Horizon?, Weather Extremes, Homes, and Insurance Risks, The California Gold Rush Boom, and Are You Focused on Commercial Real Estate?

Please join my So-Cal Real Estate Investors group that meets at Canyon Lake Golf & Country Club, Shoreline Yacht Club in Long Beach, and online: So-Cal Real Estate Investors.

Surviving and Thriving in 2026

By Rick Tobin

As we kick off the new year here in 2026, many of us wonder if this year will be stronger or weaker and whether or not this will be more of a buyer’s market than a seller’s market. Either way, there will be success if we focus more on the potential solutions and opportunities more so than the temporary obstacles standing in our way.

Prices for goods, services, or assets like homes can be simplified by way of the Law of Supply and Demand as I learned in past Economics courses that I took as a student and later wrote as an author.

When supply exceeds demand, prices tend to value. Conversely, increasing demand and decreasing supply usually cause prices to rise.

Let’s review some factors that may cause home prices to be flat or drop here in 2026:


Concerning Housing and Economic Trends

1. As of Q4 2025, U.S. home sellers or listed homes outnumbered buyers by 530,000, which was an all-time record high. This is partly due to home prices being at or near all-time record highs in most U.S. regions, while making housing costs more unaffordable.

For example, the U.S. home price-to-median household income ratio is close to 7.0x, near an all-time high. For comparison purposes, the 2006 housing bubble price peak was 6.8x.

The difference between the median U.S. home price ($426,800) and household income ($83,700) reached $343,100 in Q4 2025, which was the largest gap in history as per Barchart.

2. U.S. homebuyer demand is near the lowest level on record primarily due to how unaffordable payments and home prices are across the nation. The typical homebuyer needs to pay 39% of their gross income in order to afford to purchase a home. Sales demand plummeted to the lowest level in 40 years (only 4.7% of occupied homes sold in 2025, which was the lowest number since 1982), as per Reventure.

Please note that this is gross income (before taxes). In many states like California, the combination of state and federal taxes brings this monthly income much lower, so many buyers are paying upwards of 50% to 65% of their net monthly income to buy or lease a home.

3. We have an inverted housing market in so many different ways, especially as it relates to age. There are more home buyers over age 70 than under 35 in today’s upside-down housing market. The average U.S. home seller age in 2025 64, while the average Realtor age is 60 as per NAR. The average first-time home buyer in California last year was 49.

4. The published national home listing inventory supply is rising, while still being almost half of peak highs in 2007 when it reached near 4,000,000. Yet, this seemingly “good news” is offset by the possible “bad news” that’s included next as #4.

5. The distressed “shadow inventory” is much larger than the published national home listing supply. The national home listing inventory and published foreclosure date is nowhere close to being accurate and is artificially suppressed, partly due to the millions of distressed forbearance deal (FHA and VA loans, especially) situations where many homeowners haven’t made a single mortgage payment dating back as far as October 2020 when many of the Covid-19 forbearance plans started. As these distressed properties later become listings or go to foreclosure, the home listing supply should increase.

6. Average new U.S. home prices are now priced below older existing homes, which is something that rarely happens because most buyers are willing to pay a price premium for a new home with all of the fancy new appliances and other gadgets. Builders are so inspired to unload their unsold inventory that they’re offering massive credits to buyers to buy down their mortgage rates and pay for their closing costs.

Let’s take a closer look at data that was originally compiled by ResiClub as it relates to how unsold new home inventory increased between July 2016 and July 2025:

The unsold new home number for July 2025 was the highest number since July 2009 (126,000), which was when the housing market was near the previous bottom during the depths of the Great Recession.

7. The most important word in the “single-family home” description is family. As the family unit continues to rapidly decline, it will directly impact future home value trends.

Here’s some other family trends that I’ve shared in past articles such as The Interplay of Medical, Insurance, and Housing Financial Burdens:

* The overall divorce rate in Orange County, CA is 72%; it’s 60% in California; and 50%+ nationwide.
* 41% of first marriages end in divorce, 60% of second marriages end in divorce, and 73% of third marriages end in divorce.
* The average length of a marriage in the U.S. that ends in divorce is 8 years from start to finish.
* Since 1990, divorce rates for people over 50 have doubled; they’ve tripled for people over 65.
* The U.S. now has the highest percentage of single-person households in the world and lowest marriage rates ever.
* U.S. fertility rates are the lowest ever, as fewer babies are born.
* USA is #1 for highest teen pregnancy rate in the industrialized world.
* Approximately 50% of children are born to unmarried women under 30 here in the USA.

8. The purchasing power of $1 fell to about 7 cents over the past 50 years, so most of the dollar’s decline in value has taken place during this 50-year time period that followed the removal of the dollar from the gold standard during the 1971-1973 years as I shared in the Asset Prices Surge Amidst Dollar Devaluation Trends article.

Because real estate is an exceptional hedge against inflation as home values tend to rise at least more than double the annual published inflation rates, this has actually been a positive for homeownership and a huge negative for other products and services.

9. The median household family income is not keeping up with rising costs for things like housing, cars, education and healthcare. This is partly due to rising divorce and unemployment rates and the ongoing collapsing purchasing power of the dollar.

For example, let’s compare income and expense data dating back to 1970, which was just one year before President Nixon removed our dollar from the gold standard and inflation skyrocketed, while our purchasing power imploded over the past 50+ years.

The median U.S. household income increased from $10,000 in 1970 up to $106,000 in 2025, which was an increase of 10x (or 10 times). Please note that this is household income, which may include multiple income sources from the adult occupants.

While the rising household income was a positive, the negatives were as follows during that same 1970 to 2025 timespan:

● Median U.S. home prices rose from $25,000 to $445,000 (double this amount in California), which was an increase of 17x.
● Median car prices jumped from $3,600 to almost $50,000, which was an increase of 14x.
● The median college price rose from $2,900 per year to $45,000, an increase of 16x.
● The average costs of healthcare per person skyrocketed from $350 to $14,600 per year, which was a massive increase of 42x.
Source: The Finance Newsletter

Positive Housing and Economic Trends

1. More than 40% of owner-occupied single-family homes are now owned free-and-clear with no mortgage debt. Homeowners with no debt are much more likely to not sell at hefty future discounted prices because many of these homeowners, or their heirs, can just sit back and wait for the housing market to strengthen again.

2. Large billion and trillion-dollar corporations like BlackRock, Vanguard (largest BlackRock shareholder), Blackstone (a BlackRock spinoff and the world’s largest commercial real estate owner) continue to purchase both residential and commercial real estate.

3. An increasing number of foreign buyers from places like China, Japan, and India keep purchasing U.S. real estate. As per this linked video from the Econofin team, there’s potentially a $56 billion dollar cash buyer invasion from foreign investors (a +44% foreign investor percentage surge) that is keeping real estate demand steady in many U.S. regions.

4. The ongoing “shadow inventory” of distressed residential and commercial real estate properties and mortgages, which includes the estimated all-time record high 12%+ of all FHA loans that are currently delinquent and trillions of dollars’ worth of ballooning commercial mortgages, are continued to be delayed via “extend and pretend” strategies or silently being sold off to huge investment funds. As a result, these strategies are artificially suppressing the residential and commercial real estate inventories that may keep values at least flat instead of rapidly declining.

5. Both short-term and long-term rates are expected to keep falling in 2026. Lower rates make home purchases more affordable for an increasing number of buyers. Mark Zandi, the well-known Moody’s Analytics economist, forecasts at least three rate cuts in 2026 as shared in this recent CNBC article.

6. Existing-home sales are projected to rise by around 14% in 2026, according to the National Association of Realtors (NAR) Chief Economist Lawrence Yun, partly due to lower rates and increasing home listings for sale.

7. The dollar is more likely to keep falling in 2026 which, in turn, should push asset values higher like we saw in 2025 with these asset gains:

● S&P 500: +16.65%
● Nasdaq 100: +20.14%
● Dow Jones: +13.40%
● Russell 2000: +11.31%
● Gold: +61.48%
● Silver: +139.21%

Source: The Market Hustle


Back in Rome in 284 AD, Spain in 1607, the Netherlands in 1815, and Great Britain in 1931, each region saw the price of gold and silver triple just a few years before their economic and currency resets. We’ve seen the same thing happen here with skyrocketing gold and silver prices in the U.S. in recent times, interestingly.

8. Pending home sales jumped +3.3% month-over-month in November 2025, as per the NAR. This was the 4th-consecutive monthly gain, which matched the longest streak seen during the 2020 pandemic declaration dates. The West posted the largest pending home sales increase, which is very positive for our home state region of California and other nearby states.

9. There were almost 40 million more people who lived in the U.S. in 2025 than back in 2007. Because there’s still a shortage of affordable housing to rent or buy, the demand for properties should remain solid.

Be Proactive, Not Reactive

Whether you think that the housing market will boom, bust, or be flat in 2026 for your target housing region, there will still be opportunities.

For buyers, you may have much less competition to write up discounted offers that may be more likely to be accepted by a motivated seller with a property listing that is sluggish at 6 months DOM (Days on Market) or longer. It’s better to be the only buyer prospect than having to compete with 80+ other buyers or investors willing to pay prices well above the list price.

If both home values and rates drop significantly in 2026, it may allow you the option to buy your very first home or rental property. If so, this is positive news for you to build up your future net worth by being brave enough to purchase in today’s hectic world.

Please research on almost a daily basis to stay on top of housing market trends. In any type of housing market and economic cycle, there are fortunes waiting to be created for those people willing to take action instead of just being fearfully reactive and/or inactive.

The more you learn, the more likely that you will survive and thrive in 2026 and beyond.


Rick Tobin has worked in the real estate, financial, investment, and writing fields for the past 30+ years. He’s held eight (8) different real estate, securities, and mortgage brokerage licenses to date and is a graduate of the University of Southern California.

Rick provides creative residential and commercial mortgage solutions for clients across the nation. He’s also written college textbooks and real estate licensing courses in most states for the two largest real estate publishers in the nation; the oldest real estate school in California; and the first online real estate school in California.

Please visit his website at Realloans.com for financing options, join his investment group at So-Cal Real Estate Investors, and follow his new So-Cal Real Estate TV channel for more details.


Rick Tobin
Realloans (Real Estate Loans)
https://realloans.com/
Phone or Text: (760) 485 – 2422
NMLS 1934868
Equal Housing Opportunity / Equal Housing Lender
To quickly apply online: Loan Application
For our real estate course: Learn Real Estate

Please follow our new real estate channel (watch on television, computers, and phones): So-Cal Real Estate TV

Our Facebook business pages: Realloans, Inside Los Angeles, Inside Pacific Palisades, Inside Long Beach, Inside Huntington Beach, Inside Orange County, Inside La Jolla, Inside San Diego, Inside Lake Elsinore, Inside Temecula Valley, Inside Coachella Valley, and So-Cal Real Estate Investors.

Here are some of my articles: The Fall of 2025 and Rise of New Opportunities, The Intersection of Declining Home Sales and Creative Marketing, Are Lower Rates on the Horizon?, Weather Extremes, Homes, and Insurance Risks, The California Gold Rush Boom, and Are You Focused on Commercial Real Estate?

Please join my So-Cal Real Estate Investors group that meets at Canyon Lake Golf & Country Club, Shoreline Yacht Club in Long Beach, and online: So-Cal Real Estate Investors.

⏰ New Webinar, New Event, New Replay

Please review this important post from our company.


Join Us for Our NEW Investor Summit!

Thrive in 2026 – Capitalize on a Buyer’s Market

START THE NEW YEAR RIGHT – RSVP TO OUR NEW EVENT

Network with sophisticated investors from across the country in beautiful Southern California at Realty411’s NEW Real Estate Summit

To celebrate the beginning of a new year and the publishing of the latest print edition of REI Wealth Magazine #65, Realty411 is hosting a “Real Estate Investor’s Summit – Thrive in 2026, Capitalize on a Buyer’s Market!”

This one-day impactful conference is designed to help guests achieve maximum success in real estate investing and beyond. Join us on Saturday, March 28th for a one-day event featuring timely REI insight, top educators, and active investors from locally and out of state.

Realty411’s “Real Estate Investor’s Summit – Thrive in 2026!” is being held at Four Points by Sheraton Los Angeles Westside, located at 5990 Green Valley Circle, Culver City, California, 90230. The venue is located near LAX, convenient for guests visiting from out of state.

This is the place to learn real estate investing with experienced investors and real estate professionals who have personally invested both locally and throughout the United States.

Guests who join us will gain specialized knowledge and learning in diverse real estate investing topics and subjects. Our featured educators have decades of personal experience in real estate investing and will answer your complex questions.

If you are serious about positioning yourself for maximum success in 2026, join us! Learn about top markets, success strategies, insider tips, private capital, commercial real estate, and so much more.

As a bonus, all guests will receive the latest print edition of REI Wealth Magazine #65, published by Realty411.com. The latest edition of Realty411 magazine will be available, as well as past editions, too.


Realty411’s Webinar –
Surviving and Thriving in 2026

Join us online for Realty411’s latest webinar and gain access to wonderful REI education, off-market property strategies, plus insider insight from top professionals.

Our goal is to make a fantastic online and offline environment where learning and growing are key. We hope to assist as many estate investors as possible on their journey towards success.

Register now for our Surviving and Thriving in 2026 Webinar!

OUR FEATURED SPEAKER
RICK TOBIN – REAL LOANS

Rick Tobin, owner of Real Loans, has had an experienced and diversified background in the real estate, mortgage, and development fields over the past 30+ years. His affiliate companies have funded, built, and sold more than a billion dollars’ worth of residential and commercial properties over his career at various office locations in the counties of Orange (his hometown of Huntington Beach), Los Angeles (near Santa Monica and Pacific Palisades, where he was a long-time resident), and Riverside (Rancho Mirage and near Canyon Lake).

Rick has held eight (8) different real estate, securities, and mortgage brokerage licenses to date. He has been interviewed as the main guest on various television and radio shows over the years. Rick is also a University of Southern California (USC) graduate who studied Economics and Real Estate Finance. To date, Rick has had several million words published over the past 30 years about real estate, finance, economics, investing, taxes, and other topics.

Rick is on the Board of Directors for the Trusted Business Partners networking group, with chapter locations throughout many parts of Southern California, as well as on the Board of Directors for the Canyon Lake Chamber of Commerce. He is an active member and supporter of the Lake Elsinore Chamber of Commerce and the Menifee Chamber of Commerce as well. He also proudly serves as the First Commander at our nearby Sons of the American Legion.

Rick also leads the So-Cal Real Estate Investors group where he teaches people how to creatively buy, finance, and sell real estate. Rick has hosted several events over the years with many groups and with Realty411 at locations such as Canyon Lake Golf & Country Club, the Laguna Cliffs Marriott Resort in Dana Point, and at Shoreline Yacht Club in Long Beach.

Be sure to join us for this informative session filled with strong statistics, fun facts, timely trivia, and loads of holiday fun. 


Webinar Replay with:

Amanda Hart – Easy Street Capital

For those who attended last weeks’ webinar in person, thank you. If you missed the live webinar, we do have replay for you to watch. The video is a segment of the webinar.

Amanda’s presentation on Hard Money Lending was extremely insightful and she breaks down complicated financial concepts in an easy format, be sure to watch this informative video replay.

Amanda Hart has been lending with Easy Street Capital since 2021, now working exclusively with investors on their rehabs, rentals, and new build construction goals.


The Fall of 2025 and Rise of New Opportunities

By Rick Tobin

“All the trees are losing their leaves, and not one of them is worried.”
– Donald Miller

Our lives have often been compared to the four seasons of spring, summer, fall, and winter. Regardless of whether you perceive your current situation in life as bright and sunny or dark and doomy, each season of life is a new opportunity for positive growth that you should embrace.

It’s generally much easier to be grateful when life seems easiest, most fun, and when you have plenty of cash in your pockets. However, some of our best learning experiences tend to happen during our most challenging seasons of life if we’re willing to focus on the potential solutions and opportunities more so that the temporary obstacles standing in our way.


When many of us think of the fall season, it can be described as a time when natural beauty nearby is filled with colorful trees and more vivid sunsets and weather temperatures are seemingly ideal in most regions.

However, the word “fall” also has negative connotations such as the “Fall of Rome” era, or the end of the Western Roman Empire, that happened near 476 AD when the most powerful region in the world collapsed due to massive health challenges and death from the bubonic plague or Black Death which, in turn, led to hyperinflation, numerous unusual firestorms, a devalued currency system, and war.

“All roads lead to Rome,” as the old saying goes, because history tends to repeat itself, for better or worse.

The Fall of 2025’s Economic Data

Let’s take a closer look below at some concerning economic data that’s been recently shared:

* Foreclosures increased 20% in October 2025.
* Job layoffs in October were the most in 22 years. Published year-to-date job layoffs in 2025 have surpassed year-to-date job losses in 2008.
* New job hires are the slowest since 2009.
* The savings rate is the lowest on record.
* 12.1% of FHA loans are delinquent and make up almost 50% of all Q3 foreclosures.
* Consumer Credit Applications are now being rejected at nearly 25%, the highest rejection rate ever recorded, according to Charles Schwab and the New York Fed as of 10/31/25.
* Mortgage refinance application rejection rates hit 45.7%, an all-time high.
* Average past-due utility bills hit an all-time high at $789, as per The Century Foundation & the University of California Consumer Credit Panel.
* Car repossessions are the highest since 2009.
* The 60-day delinquency rate for subprime automobile loans just reached an all-time record high of 6.65% in October 2025.
* Automobile loan rates are approaching record highs, especially for subprime borrowers (13% to 30%+ rates).
* Student loan delinquencies are the highest ever with nearly 20% of borrowers at 90 days or longer for missed payments.
* Unpaid credit card debt balances reached a record $1.233 trillion in Q3 2025.
* Credit card APRs (rates and fees) are near the highest ever (24%-40%+).
* Early paycheck advance loan rates are as high as 400% to 520% APRs.
* More than 50% of Americans use Buy Now, Pay Later (BNPL).

Worsening Debt Trends

In addition to all-time record highs for unpaid credit card debt reaching 1.233 trillion dollars in the third quarter of 2025, the US credit card capacity, or maximum credit card limits, reached a new record high of $5.3 trillion, according to the New York Fed.

However, there’s still nearly $4 trillion dollars in available unused credit for US borrowers to access from their credit cards.

Credit rejection rates for most types of new credit applications continue to soar to new highs, as per New York Fed data and The Kobeissi Letter.

For example, let’s review the percentage rates for credit application rejection rates in recent times:
● Automobile loan rejection rates: 15.2% (second highest on record)
● Credit card rejection rates: 21.2%
● Overall credit application rejection rates: 24.8% (new record)
● Mortgage application rejection rate: 45.7% (new record)

These rejection rates have accelerated at a faster pace since 2020 for many lenders. For example, the overall rejection rate for credit applications has risen by +10.4% between February 2020 and Q3 2025.

Snowballing Federal Debt

In 1790, US national debt was just $70 million. By 1980, it reached $1 trillion for the very first time, which took 220 years to reach. Now, we’ve surpassed a staggering $38 trillion in debt.

It took more than 200 years for the federal debt to surpass the first $1 trillion dollar debt balance number in October 1981. Now, the US federal debt compounds and increases by another $1 trillion every 75 days or so.

The US Treasury posted a $284.4 billion deficit in October, which was the worst opening month to any fiscal year in history.

October’s Interest payment on US debt was a record $104.4 billion, as per Stock Sharks. To put this into better daily perspective, US federal debt is growing at a pace of $22.5 billion every single day.

How is all of this federal debt good for real estate investors?

Answer: It’s more likely than not that inflation will keep rising and the dollar’s purchasing power will keep falling. Because real estate is an exceptional hedge against inflation and an imploding dollar, home prices may either stabilize or keep increasing even if the overall economy keeps on weakening.

Positive Housing Trends in 2nd Half of 2025

Now, let’s review some more positive housing data for Q3 2025:

Single-family home prices had positive gains in 77% of 2350 metro areas in Q3 2025, according to NAR.

Rising Home Prices in Most Metros – Q3 2025

“Home prices rose in Q3 2025, with national median prices up 1.7% to $426,800. Monthly mortgage payments increased to $2,187. The median family income needed for a 20% down payment is $104,996.”
– NAR Research

The Top 5 single-family areas with the highest home appreciation rates in Q3 2025 were are as follows:

1. Owensboro, KY
2. Rockford, IL
3. Springfield, IL
4. Cape Girardeau, MO-IL
5. Fond du Lac, WI

The Top 5 Most Affordable Housing Regions

Here are the Top 5 most affordable cities in America as of October 2025, which have much lower percentage of income to monthly household payment numbers:

Out of the 100 major cities analyzed by RealtyHop, an estimated 68 of the cities had homebuyers paying more than 30% of their monthly income towards household expenses.

Unaffordable Housing Challenges

The dollar’s purchasing power continues to fall at a rapid pace. As a result, it’s still quite challenging to purchase groceries, clothing, cars, or homes at seemingly affordable prices.

The Top 5 Most Unaffordable Housing Regions

Two of the top 5 most unaffordable housing regions in America are located in Southern California – #1 Los Angeles and #2 Irvine, as per the RealtyHop Housing Affordability Index for October 2025.

Average families who earned the median income in Los Angeles must now spend a shockingly high percentage of 84.16% of their income on home ownership costs, as discovered in this RealtyHop survey. If true, the average Los Angeles resident would have just over 15% of household income left over to purchase groceries and pay for utilities, automobiles, clothing, home maintenance, and other basic necessities if they were actually able to qualify for a home mortgage with those very high debt-to-income ratios.

2025’s Most Unaffordable Highest Home Price-to-Household Income Ratio

In 2025, the Top 10 most unaffordable cities with the highest home selling price-to-income ratio are as follows:

1. Los Angeles, CA (12.2x),
2. San Jose, CA (11.0x),
3. Long Beach, CA (10.4x),
4. San Francisco (10.0x),
5. New York, NY (10.0x),
6. San Diego, CA (9.6x),
7. Miami, FL (8.5x),
8. Boston, MA (7.7x),
9. Oakland, CA (7.7x)
10. Seattle, WA (7.2x).
Source: Constructive Coverage

Income & Home Price Disconnection

Sadly, household income has not been rising as quickly as home prices over the past several decades, especially in California. This is partly why more family members are co-signing for mortgages to help buyers qualify.

● Median U.S. household income in 1968: $7,700/year

● Median U.S. household income in 2025: $66,000/year

● Median U.S. household income percentage increase between 1968 and 2025: +764%

● Median U.S. home price percentage increase between 1968 and 2025: +1,967%

Sources: Realtor.com, US Census, and SoFi

Increasing Mortgage Purchase Applications

In spite of mortgage application rejection rates hitting new all-time highs at 45.7%, US consumers are filling out mortgage applications at a faster pace. This may be partly due to so many lenders rejecting mortgage applications and borrower prospects may be completing multiple mortgage applications to qualify.

“US mortgage applications surged to the highest level since 2023 last week.

The Mortgage Bankers Association’s index of home-purchase applications jumped 7.6% to 181.6 in the week ended Nov. 21, 2025.”
Yahoo Finance


Buyer and Borrower Opportunities

The combination of falling rates and falling prices usually inspires more buyers to start looking at properties to purchase. For those buyer prospects who’ve been struggling to qualify for homes priced near all-time record highs in their region may now be pleasantly surprised to learn that they now can actually buy a home.

It’s never been more important than this season of your life to work with experienced mortgage and real estate licensee professionals who have been through the numerous booms and busts of the real estate seasons over the years or decades.

If you have credit or income issues, then please focus on ways to better improve them sooner rather than later so that you’re more likely to later qualify to buy your dream home or the next investment property for your portfolio.

Since the average buyer and seller age these days are within the 59 to 64 age range, many of these same buyers and sellers also made it through both the dark and doomy real estate investing eras up until they started to see more daylight in the perceived sunnier-like seasons.

Tenacity is what’s needed through each season. Instead of worrying about the coldest and darkest days, just remember that it’s always darkest before dawn because the sun does rise every single day just like you do when you rise up out of bed.


Rick Tobin

Rick Tobin has worked in the real estate, financial, investment, and writing fields for the past 30+ years. He’s held eight (8) different real estate, securities, and mortgage brokerage licenses to date and is a graduate of the University of Southern California. He provides creative residential and commercial mortgage solutions for clients across the nation. He’s also written college textbooks and real estate licensing courses in most states for the two largest real estate publishers in the nation; the oldest real estate school in California; and the first online real estate school in California. Please visit his website at Realloans.com for financing options and his new investment group at So-Cal Real Estate Investors for more details. 


Learn live and in real-time with Realty411. Be sure to register for our next virtual and in-person events. For all the details, please visit Realty411.com or our Eventbrite landing page, CLICK HERE.

The Intersection of Declining Home Sales and Creative Marketing

By Rick Tobin

“If you always do what you’ve always done, you’ll always get what you’ve always got.” – Henry Ford

The only constant in life is change. Today’s sluggish housing market offers us all both chaos and opportunity, whether you are an investor, first-time home buyer, seller, real estate agent, or mortgage broker.

There’s an old saying that is very true: Everything that you’ve ever wanted is on the other side of fear. For many people, they may read negative data trends, freeze up, and refuse to make any changes to their marketing strategies as a seller, buyer, or real estate or financial professional.

The key is to review as many positive, neutral, and negative data trends, while staying focused on the potential opportunities and solutions rather than getting seemingly hypnotized or frozen by the temporary obstacles standing in your way.


Declining Housing Sales Turnover Rate

Today’s U.S. housing market has the lowest sales turnover rate in at least 30 years, as per sources like Redfin and The Kobeissi Letter. Only 28 homes out of every 1,000 homes, or 2.8%, changed hands by way of sales in the first nine months of 2025.

The housing market is frozen with a much lower sales volume here in 2025, partly due to a mortgage rate lock-in effect, where nearly 70% of all homeowners currently hold mortgages with rates near 5% or below. I’ve written about the “lock-in effect” over the past few years in articles like this one that was published in July 2023: The Lock-In Effect and Keys to Success.

Even though the average 30-year fixed rate fell to a one-year low near the low 6% rate range by the end of October 2025, median home prices in many U.S. regions are near or at all-time record highs. As a result, fewer home buyers can afford to purchase their dream home because they can’t afford the mortgage payment along with other consumer debts.

Pending Home Sales Aren’t Improving

Pending home sales, which track the number of home sales contracts signed, didn’t change much in September 2025 as compared with the previous month of August.

This is now the third year in a row that pending home sales have remained near record lows as per data shared by the National Association of Realtors, dating back to July 2010.

There really hasn’t been any significant improvement over the past three years, as shared via YCharts below and in data compiled by Wolf Street in their article here: Home Sales Have Not Improved at All Despite the Lowest Mortgage Rates in a Year

Pending home sales compared to the Septembers in prior years:
● 2024: -0.9%
● 2023: +1.2%
● 2022: -8.3%
● 2021: -35.1%
● 2020: -41.1%
● 2019: -30.7%
Source: WolfStreet.com

In the West, pending homes sales fell by 0.2% in September from August, and were down 5.3% year-over-year.

Compared to the Septembers of prior years:

● 2024: -5.3%
● 2023: +3.9%
● 2021: -42.1%
● 2020: -47.8%
● 2019: -39.5%

Rising Buyer Fallout Rates

As of August 2025, the national buyer fallout rate surpassed 15% as nearly 1-in-7 home-purchase agreements were canceled, as per a Redfin study. This was the highest cancellation rate for the month of August in Redfin’s records, which date back to 2017.

Some key factors for the rising buyer fallout rates include the combination of record high unaffordability rates for many buyers along with record high average mortgage payments and credit card debt, student loan balances, home insurance costs, and automobile loans at or near all-time record highs on the buyer’s side.

However, many sellers still think that their homes should sell for record high prices, while also refusing to offer any concessions like credits for home repairs or closing costs.

According to another study published by Redfin that included a survey of 443 Redfin agents that was conducted in September 2025, here were the most common reasons for buyers or sellers backing out of their signed home purchase contracts and the percentage of contracts that were affected:

● Home inspection or repair issues: 70.4% of all contracts canceled
● Buyer financing fell through: 27.8%
● Buyer unable to sell current home: 21%
● Change in buyer’s financial situation: 14.9%
● Buyer found another property they liked better: 12.9%
● Concerns about the economic climate: 12.2%
● Seller backed out: 11.5%
● Low appraisal: 7.9%
● Insurance issues (too expensive or couldn’t find coverage): 7%
● High mortgage rates: 6.5%

Target Older Home Sellers and Buyers

If you’re a real estate licensee, a higher percentage of your potential home seller clients are likely to be near the ages of 50 to 60 years. In fact, the median age of a home seller across the nation in 2024 was an all-time record high 63 years of age, according to the National Association of REALTORS® (NAR).

As I’ve shared before, the median age of a first-time home buyer in the state of California in 2024 was 49 years of age. Again, this was the average first-time home buyer age that used to be in the 20s or 30s in past decades. This is partly because California home prices tend to be almost double the national average, so fewer younger people have the cash or income to qualify for a mortgage.

Because of the older median home seller age, real estate professionals and buyers interested in purchasing either their first home or their 20th investment property should focus on senior-housing communities (55 and older) and other regions where the sellers are more likely to be interested in selling and possibly moving to a smaller property or into other family member’s homes.

For home sellers and their advising listing agents, the Days on Market (DOM) numbers are starting to increase in many U.S. regions. As a result, your creative marketing techniques must be enhanced or tried for the very first time to inspire more people to view your listings online and later visit in person.

NAR’s Home Study Report

The National Association of REALTORS® recently published a very informative study that’s entitled 2025 Home Buyers and Sellers Generational Trends Report, which included details about home buyer characteristics and sales financing trends such as follows:

Characteristics of Homes Purchased

○ Fifteen percent of Younger Boomers bought new homes, compared to only 10 percent of Older Millennials, and nine percent of Younger Millennials.

○ At 42 percent, most recent buyers who purchased new homes were looking to avoid renovations and problems with plumbing or electricity. Buyers who purchased previously owned homes were most often considering a better overall value at 31 percent. Younger Boomers were more likely to purchase a new home to avoid renovations and problems with plumbing or electricity.

○ The most common type of home purchase continued to be detached single-family homes, which comprised 75 percent of all homes purchased.

○ Nineteen percent of buyers over the age of 60 purchased senior-related housing; that number was twenty-five percent for Older Baby Boomers and 27 percent for the Silent Generation.

○ The typical home recently purchased was 1,900 square feet, had three bedrooms and two bathrooms, and was built in 1994.

○ Overall, buyers expected to live in their homes for a median of 15 years, the same as last year.

Financing the Home Purchase

○ Seventy-four percent of recent buyers financed their home purchase. More than 90% of buyers 44 years and younger financed, whereas only 49 percent of Older Baby Boomers and 41 percent of the Silent Generation financed their home.

○ Forty-nine percent of buyers said their down payment came from their savings. Forty-five percent of comparable down payment came from the proceeds from the sale of a primary residence. Seventy-one percent of Younger Millennials and 60 percent of Older Millennials used savings for their down payment, compared to only 37 percent of Older Boomers and 35 percent of the Silent Generation. Older buyers were most likely to use equity from a past home. Younger Millennials used gifts or loans from friends and family more than any other generation.

Home Sellers and Their Selling Experience

○ Younger Boomers made up the largest share of home sellers at 31 percent, had a median age of 65 years, and a median income of $110,700. Gen Xers and Older Boomers comprised the second largest share of sellers at 22 percent.

○ Sixty-nine percent of sellers were married couples. Married couples were highest among Younger Millennials at 82 percent.

○ For all sellers, the most commonly cited reason for selling their home was to move closer to friends and family (23 percent), the home was too small (12 percent), followed by the home being too large (11 percent). Older generations were more likely to move closer to family/friends, and younger generations were more likely to desire a larger home.

○ Ninety percent of home sellers worked with a real estate agent to sell their homes, which was consistent across all age groups.

Helping Realtors & Investors Close More Deals

I’ve created hundreds of articles about fix-and-flips, short sales, seller-financing (subject-to, wraparounds, & paper flips), foreclosure bailouts, and have written real estate licensing courses and college textbooks for the two largest real estate publishers in the nation as well as for the oldest and best-known real estate school in California.

Our team can help you in the following ways:

● I’ve taught real estate licensees in their offices or online and other investors how to find clients, distressed properties, and boost their sphere of influence to find more clients and homes to sell or buy.
● I can teach home buyer prospect seminars either in person or online how to qualify for a home mortgage for Realtor clients.
● Depending on the zip code, city, or county region, my team may be able to refer you to potential distressed properties to purchase or list for sale.
● We’ve assisted with qualifying home buyer prospects at open houses and also provided coffee, donuts, sandwiches, and other types of items that may increase the number of visitors.
● If the seller is distressed (forbearance or foreclosure type of situations) with potentially negative equity and/or years of no mortgage payments made for either residential or commercial real estate properties, my past clients included the #1 largest short sale investor in the nation. I can help negotiate with the existing lender or loan servicing company to get the home sale completed.
● If you or your clients have credit issues, I’ve written numerous courses about credit and may help quickly increase your clients’ FICO credit scores for free.
● I can get you fast pre-approvals and help structure the offer with maximum credits to minimize cash to close.
● My Realloans team and I will simplify your complex deals so that you and your clients are relieved, calm, happy, and close on time.
● I lead the So-Cal Real Estate Investors group where we share the latest real estate trends and deals available for purchase.
● I’m also affiliated with hundreds of real estate investment clubs and 1031 tax-deferred exchange groups, which have tens of thousands of qualified or all-cash buyers who can close quickly.
● We can help get you more views for your listings by sharing mortgage flyers or videos with you and on my networking platforms to optimize viewer traffic.

As we approach the end of 2025 and get ready for the new year, 2026 can either be your best year ever as a real estate licensee or investor, or it could be quite challenging if you’re not willing to make necessary changes.

The choice is yours and yours alone as to your willingness to attempt new creative marketing strategies to boost your sales and/or purchase numbers.

I’m here to help you reach and surpass your goal targets. The best time to start is today, not next year. Best wishes for success in 2026 and beyond!


Rick Tobin

Rick Tobin has worked in the real estate, financial, investment, and writing fields for the past 30+ years. He’s held eight (8) different real estate, securities, and mortgage brokerage licenses to date and is a graduate of the University of Southern California. He provides creative residential and commercial mortgage solutions for clients across the nation. He’s also written college textbooks and real estate licensing courses in most states for the two largest real estate publishers in the nation; the oldest real estate school in California; and the first online real estate school in California. Please visit his website at Realloans.com for financing options and his new investment group at So-Cal Real Estate Investors for more details. 


Learn live and in real-time with Realty411. Be sure to register for our next virtual and in-person events. For all the details, please visit Realty411.com or our Eventbrite landing page, CLICK HERE.

Rising Property Taxes and Insurance: A Growing Concern for Homeowners

By Rick Tobin

Property tax and homeowners insurance payments have risen so much in many U.S. regions that the monthly property tax and homeowners payments can both be as high as an average mortgage payment. It’s truly a pity that the monthly PITI (Principal, Interest, Taxes, and Insurance) payments have reached unaffordable levels for so many homeowners across the nation.

An analysis by Lending Tree that was published and updated in May 2025 found the median property taxes across the nation rose by an average of 10.4% between 2021 and 2023.

Whether or not a homeowner owns their property with or without a mortgage, they must continue to pay at least their property tax payments or risk losing the residential or commercial property to a future foreclosure tax sale.

By comparison, the decision to hold a homeowners or landlord insurance property on a free and clear property is solely up to the property owner who is willing to take the risk associated with fires, floods, and other damaging events. Many landlords today with free-and-clear properties may also have negative cash flow, so they stop paying for insurance.


Property Tax Trends

Let’s take a closer look at what was gathered, analyzed, and shared by both Lending Tree and the Tax Foundation as it relates to property tax and homeownership trends through 2023:

● U.S. homeowners paid a median property tax payment of $2,969 annually, or about $247 per month.

● Homeowners without a mortgage can select insurance policies with lower coverage limit amounts because they don’t have to also protect a mortgage lender on the same policy. As a result, the annual premium amounts are usually lower for homes with no mortgage debt.

● Homeowners without a mortgage for their free-and-clear properties paid a median of $2,474 in annual property taxes, while those with a mortgage paid almost $869 more per year at a median of $3,343.

● More than 40% of U.S. homes today are now owned without a mortgage. Some of these homeowners choose not to obtain any insurance for their properties to keep expenses low. In theory, this may make sense until a future firestorm or horrific flooding situation damages their property so severely that they must tear it down.

Low and High Property Tax Regions

Depending on the price paid and the tax assessment percentage rate for the subject property’s county region, annual property taxes paid can vary from $1,000 to $100,000+ per year.

Between 2021 and 2023, property taxes increased in each of the 50 largest metro regions. The three metropolitan regions with the lowest annual property tax payment increases were as follows:

1. Pittsburgh, PA: +4.4%
2. Philadelphia, PA: +8.2%
3. Milwaukee, WI: +8.3%

Conversely, the three metropolitan regions with the highest annual property tax increases were located here:

1. Tampa, FL: +23.3%
2. Indianapolis, IN: +19.8%
3. Dallas, TX: +19.0%

This same Lending Tree study found that among the 50 largest metropolitan areas, Birmingham, Alabama, had the lowest median annual property taxes at $1,091 per year. Memphis, Tennessee and Louisville, Kentucky had the second and third lowest annual property tax payments out of the 50 largest metro regions at $1,856 and $1,912, respectively. Amazingly, Birmingham’s annual property tax payments were 41.2% lower than the #2 lowest annual property tax region in Memphis.

Among the 10 metros with the highest annual property taxes, four are located in California and two are in Texas. Out of the large 50 metros, these three regions have the highest annual median property taxes:

1. New York, NY: $9,937
2. San Jose, CA: $9,554
3. San Francisco, CA: $8,156

Birmingham, Alabama and Phoenix, Arizona pay the smallest percentage of their home value in property taxes out of the 50 largest metropolitan regions at an effective tax rate of just 0.48%. Both Las Vegas and Denver pay slightly higher amounts at 0.50%.

Surprisingly, Buffalo, New York (2.11%), Chicago (2.08%), and Cleveland (1.74%) had the three highest effective tax percentage rates out of the top 50 metropolitan regions.

Property Taxes by County

Within each state, counties can assess different property tax percentage rates and special assessments that can increase or decrease the property taxes paid by each homeowner. Sometimes, counties or county equivalents can run out of cash and file for bankruptcy. If so, they may increase the property tax percentage rates owed to help cover their annual budgets for schools, roads, and other expenses.

Lowest Property Taxes

In 2023, the lowest annual property tax bills in the nation were found in 11 counties, or county equivalents (parishes, boroughs, etc.), with median property taxes of less than $250 per year, according to the Tax Foundation.

These counties, or county equivalents, had property tax amounts at $250 per year or less, as follows:

● Alabama: Lamar and Choctaw counties
● Alaska: Northwest Arctic Borough, the Kusilvak Census Area, and the Copper River Census Area
● Louisiana: Allen, Avoyelles, Madison, Tensas, and West Carroll parishes
● South Dakota: Oglala Lakota County

In many regions of Alaska, there are actually $0 property tax payments due each year. As such, these areas in Alaska would officially have the lowest property tax rates and payments in America.


Highest Property Taxes

Now, let’s review the 16 counties with the highest median property tax payments in the nation that all have annual tax bills exceeding $10,000 per year:

● California: Marin County
● New Jersey: Bergen, Essex, Hunterdon, Monmouth, Morris, Passaic, Somerset, and Union counties
● New York: Nassau, New York, Putnam, Rockland, Suffolk, and Westchester counties
● Virginia: Falls Church City

Additionally, two counties in New Jersey (Hudson and Middlesex), three counties in California (San Francisco, San Mateo, and Santa Clara) and the Western Connecticut Planning Region in Connecticut have annual median property taxes above $9,000 and slightly below $10,000.

Reasons for Increasing Property Taxes

Property taxes are the primary tool for financing local governments. For example, property taxes comprised 27.4% of total state and local tax collections in the U.S., which was more than any other tax revenue source.

Property taxes collected are then used to fund schools, police departments, fire and emergency medical services, roads, and other services. As a percentage of local tax collections in regions like counties, property taxes accounted for more than 70% of local tax collections in fiscal year 2022.

Rapidly increasing salaries, underfunded pension needs, and overall county budget increases for county employees are also reasons why property taxes are going higher to cover these budget deficits.

Because home prices have reached all-time record highs in many U.S. regions, the corresponding property tax assessments have risen as well because they are based on the home purchase price or latest assessed value.

Skyrocketing Insurance Costs

Sadly, insurance costs are seemingly increasing at an even faster pace across the nation than property taxes and monthly mortgage payments.

It’s not uncommon these days for homeowners or landlords to pay $500, $1,000, $2,000, or $5,000+ per month (not year) to have sufficient insurance coverage that protects them and their mortgage lender.

As I’ve shared in past articles like The Drying Disaster-Relief Insurance Pools, a large number of insurance companies and government agencies that back insurers may be technically insolvent after several decades’ worth of costly and deadly firestorms, floods, hurricanes, tornadoes, and other natural or manmade events.

California’s own “insurer of last resort” named the FAIR Plan had upwards of $336 billion of property exposure a year ago with just a cash surplus between $300 and $700 million, as per the California Assembly Insurance Oversight Committee.

This FAIR Plan budget analysis took place well before the absolutely horrific firestorms that hit my former neighborhood of Pacific Palisades and Altadena near Pasadena, which I shared back in January 2025 one week after the firestorms hit these beautiful regions as I shared in my Steps to Recover from the Pacific Palisades Firestorm article.

There are 10 times more California homes in low-fire risk zip code regions than homes in high-fire risk regions that currently have much more expensive California FAIR (Fair Access to Insurance Requirements) Plan insurance, according to CBS News Los Angeles.

Fire Hazard Severity Zones (FHSZ) & Local Responsibility Areas (LRA)

On March 24, 2025, OSFM (Office of the State Fire Marshal) issued the 2025 Recommended Local Responsibility Area (LRA) FHSZ maps for California.

FHSZ Classification

Properties are designated as Moderate, High, or Very High Fire Hazard Severity Zones based on:
● Terrain and topography
● Vegetation and fuel conditions
● Fire history and frequency
● Climate and weather patterns

As a result of the issuance of this map, a large number of homeowners in California are losing their insurance and have no other option to choose from than the usually more expensive FAIR Plan.

Just recently, the California FAIR Plan proposed the raising of home insurance rates by an average of 35.8% starting next spring in 2026, according to this article by the San Francisco Chronicle. If this hike request is approved by the state, it would be the largest payment increase in at least seven years.

However, approximately half of California FAIR Plan customers might experience annual rate increases of 40% to 50%, while other customers could see their rates jump by more than 300%.

The Lock-In Effect

I’ve written about the lock-in effect over the years as it primarily relates to homeowners who didn’t want to sell or refinance their record low mortgage rates.

It’s not just homeowners who hold near record low 30-year fixed mortgage rates who are not motivated to sell their homes whether or not they can afford the monthly payments. Rather, a large number of homeowners today aren’t selling their homes because of factors such as fear of higher future property taxes if they acquire a more expensive home.

Many homeowners also don’t want to pay higher insurance and/or lose their low fixed rate mortgage that might be somewhere between 3% and 5%. Other homeowners are afraid to make any claims on their insurance policies even if completely justified because they don’t want to risk losing their insurance or seeing their annual premium payments double or triple.

As a result, the lock-in effect also applies to a combination of mortgage rate, insurance, and property tax swings that may be almost impossible for the average homeowner to afford if they decided to sell their home.

It’s somewhat akin to a deer-in-the-headlights type of frozen reaction for many homeowners where they don’t know what to do and the safest decision may be to sit tight and do nothing. Yet, the same holds true for potential buyers who are currently renting. Can they afford these rising mortgage, tax, and insurance payments?

At some point, home prices will be affected, for better or worse, when the number of sellers exceeds buyers or the number of buyers exceeds available home listings.


Rick Tobin

Rick Tobin has worked in the real estate, financial, investment, and writing fields for the past 30+ years. He’s held eight (8) different real estate, securities, and mortgage brokerage licenses to date and is a graduate of the University of Southern California. He provides creative residential and commercial mortgage solutions for clients across the nation. He’s also written college textbooks and real estate licensing courses in most states for the two largest real estate publishers in the nation; the oldest real estate school in California; and the first online real estate school in California. Please visit his website at Realloans.com for financing options and his new investment group at So-Cal Real Estate Investors for more details. 


Learn live and in real-time with Realty411. Be sure to register for our next virtual and in-person events. For all the details, please visit Realty411.com or our Eventbrite landing page, CLICK HERE.

Asset Prices Surge Amidst Dollar Devaluation Trends

By Rick Tobin

How are so many asset prices (homes, commercial real estate, gold, stocks, etc.) today at or near all-time record highs, while the purchasing power of the dollar is at all-time record lows? Is the economy booming like never before or is the dollar’s purchasing power seemingly crashing and burning?

A recently published Statista Consumer Insights survey that was conducted in June and July 2025 found that 49% of U.S. adult respondents said that the high cost of living was their biggest daily concern.


The Top 8 answers provided in this survey of 4,098 adults between the ages of 18 and 64 were as follows:

1. Cost of living – 49.1%
2. Physical health – 26.3%
3. Mental health – 26.0%
4. Work-life balance – 25.8%
5. Political or social issues – 22.7%
6. Age-related concerns – 16.7%
7. Housing – 16.6%
8. Career dissatisfaction or uncertainty – 16.2%

Why does it seem that many items are less affordable today than in previous years? One answer is that our dollar’s purchasing power continues to rapidly decline at an accelerating pace.

Dollar’s Purchasing Power Turns to Ash

The federal government’s published inflation rates in 2025 are still lower than inflation rates back in the 2021/2022 years that peaked near 9%. However, it sure doesn’t seem like our dollar buys the same amount of goods and services here in 2025 whether or not the published inflation rates are 2%, 3%, 4%, 5%, 9%, or 10%.

Here’s a summary of the decline of the dollar over the past 112 years:

  • $1 in 1913 (the year when the Federal Reserve was formed, ironically, as a way to “contain inflation” and “stabilize the dollar”) now has the equivalent purchasing power of almost 3 cents today.
  • The purchasing power of $1 fell to about 7 cents over the past 50 years, so most of the dollar’s decline in value has taken place during this 50-year time period that followed the removal of the dollar from the gold standard during the 1971-1973 years.
  • Since 2000, the dollar’s purchasing power has dropped by -41%.
  • The M1 money supply (cash or cash equivalent) increased from $4 trillion dollars in January 2020 to $20 trillion dollars by October 2021. The more money in circulation, the less purchasing power for the dollar.
  • The dollar’s purchasing power has fallen 10% in the first seven months of 2025 as the dollar’s losses are accelerating.
  • Because real estate has proven to be an exceptional hedge against inflation and an imploding dollar or fiat currency that’s backed by “thin air,” these are key reasons why home values today are near all-time record highs.

Falling Rates & New Buying Opportunities

The average 30-year fixed rate over the past 50 years was about 7.7%, which is actually much higher than today’s 30-year fixed rate average that is almost 1.5% lower as of the first week in September 2025.

The peak high 30-year fixed rate over the past 50 years reached 18.63% in October 1981, while the low rate average fell to 2.65% in January 2021.

On September 5, 2025, the 30-year fixed rate reached a 6.29% rate average, as per Mortgage News Daily and CNBC. This rate was near the lowest 30-year fixed rate average dating back to October 2024.

Even if the Fed takes short term rates down to near zero again like in past years, the 10-year Treasury yield may still increase due to factors such as fewer foreign buyers for our Treasury bonds, rising federal debt, and potential future credit downgrades by credit rating agencies such as Moody’s, Standard & Poor’s, and Fitch.

To learn more details about potential interest rate directions, please read my article published on August 8, 2025: Are Lower Rates on the Horizon?


Commercial Real Estate Trends

Each commercial asset class like multifamily, industrial, office, retail, and mixed-use across our nation has both positive and negative trends.

For some commercial properties owned by fortunate landlords, they may see 100% occupancy rates, record high rents, and all-time peak high property values. For other property owners, they may experience high vacancy rates, negative cash flow, and upside-side down values because their mortgage debt exceeds their current market value.

Let’s take a look below at some of the latest commercial real estate trends:

  • The estimated total dollar value of commercial real estate was $22.5 trillion as of Q4 2023, which makes it the fourth-largest asset class in the nation following stocks, residential real estate, and Treasury securities. (Federal Reserve’s April 2024 Financial Stability Report)
  • By July 2024, the national office vacancy rate reached a whopping 20.1%. This was the first time ever that the U.S. vacancy rate surpassed 20%. (CommercialEdge)
  • By early 2026, Moody’s forecasts office vacancy rates hitting 24%+.
  • In August 2025, the delinquency rate for office mortgages securitized into commercial mortgage-backed securities (CMBS) spiked to 11.7%, the worst ever default rate and a full percentage point above even the peak meltdown rate of the Financial Crisis (10.7%) during the 2008 to 2012 years, according to data by Trepp.
  • Almost 45% of all office buildings nationwide that are leveraged with debt are upside-down or underwater where the existing mortgage debt exceeds the current market value, per Bloomberg and Morgan Stanley.
  • To learn more details, please read my Are You Focused on Commercial Real Estate article.

Ballooning Commercial Loans & Motivated Sellers

Unlike most residential one-to-four unit properties that have 30-year fixed rate terms, most commercial properties have shorter term mortgages that may only last for a few years before they balloon or mature and must be paid off or refinanced.

Let’s review the ballooning commercial mortgage numbers below:

  • Approximately 20%, or $929 billion, of the $4.7 trillion dollars’ worth of outstanding commercial mortgages owed to lenders and investors were scheduled to balloon or become all due and payable by the end of 2024, as per the Mortgage Bankers Association’s 2023 Commercial Real Estate (CRE) Survey of Loan Maturity Volumes.
  • However, many of these ballooning loans were extended well beyond their maturity date because banks don’t want to acknowledge all of their current financial losses, just like back during the 2008 to 2012 era, or their bank’s stock value may go “pop.”
  • Upwards of $2.7 trillion for commercial and multifamily mortgages are set to balloon or mature by the end of 2026. (Mortgage Bankers Association)
  • In 2024, the U.S. apartment construction industry was expected to break a new all-time record for apartment units delivered with well over 500,000 units completed, which is 30% higher than back in 2022. (Fannie Mae)
  • When apartment unit supply exceeds tenant demand, rents and values tend to fall.
  • The rising multifamily apartment loan default rate is increasing due to a combination of rising adjustable rates that are resetting after 3, 5, or 7-years and skyrocketing insurance costs that creates negative cash flow.
  • The largest issuers for these ballooning commercial loans are community banks and thrifts that hold over half of these maturing loans through 2028.
  • Realloans offers interest-only and asset-based, no income verification commercial property loans with up to 30-year terms for most property types.

The Importance of Income-Producing Assets

Nearly 60% of Americans say they live paycheck to paycheck, according to surveys published by LendingClub.

Wealth distribution has become increasingly concentrated in the hands of fewer people since 1990. Overall, the top 10% of wealthiest Americans own more than the bottom 90% combined, with more than $95 trillion in wealth for the top 10%.

U.S. homeowners are 43 times wealthier than tenants. The average homeowner at retirement age has 83% of their net worth tied up in their main home.

The average age of a first-time homebuyer in the U.S. is 38, while it’s 49 here in California due to much higher prices, as per the National Association of Realtors.

The average U.S. home seller age in 2024 was 63. For many of these sellers, they first took a risky chance and bought their home more than 30 years earlier in their early 30s or late 20s.

The average homeowner at retirement age has 83% of their net worth tied up in their main home. Unless you’re in the Top 1%, the odds are quite high that the bulk of your wealth is concentrated in real estate if you’re fortunate enough to own now.

The average Social Security benefit here in 2025 is $1,976/mo. ($23,712/yr.), per Kiplinger.

The fastest growing demographic percentage increase in the workforce in 2024 was over the age of 75 because Social Security and pensions aren’t high enough, according to Pew Research.

Either you work hard for your money or you let your money or investments work hard for you when you’re awake or asleep. Yes, investing can be scary, but so can the thought of not having enough monthly income to cover your debts.

To be able to actually retire these days, many people need some form of income-producing assets creating monthly cash flow for them. It’s much riskier to do nothing today than to start investing as soon as possible.

The best time to start investing is now. Your future self and your family will later thank you.


Rick Tobin

Rick Tobin has worked in the real estate, financial, investment, and writing fields for the past 30+ years. He’s held eight (8) different real estate, securities, and mortgage brokerage licenses to date and is a graduate of the University of Southern California. He provides creative residential and commercial mortgage solutions for clients across the nation. He’s also written college textbooks and real estate licensing courses in most states for the two largest real estate publishers in the nation; the oldest real estate school in California; and the first online real estate school in California. Please visit his website at Realloans.com for financing options and his new investment group at So-Cal Real Estate Investors for more details. 


Learn live and in real-time with Realty411. Be sure to register for our next virtual and in-person events. For all the details, please visit Realty411.com or our Eventbrite landing page, CLICK HERE.