Posts

The Lock-In Effect and Keys to Success

By Rick Tobin

There sure seems to be more bad news than good news these days about the state of real estate. During turbulent times like we’ve all seen in recent years, the most common first human reaction is usually denial or acting somewhat like a locked up “prisoner” with a frozen “deer-in-the-headlights” look in our eyes. Yet, this is exactly when we should stay focused on the potential opportunities more so than the temporary obstacles standing in our way.

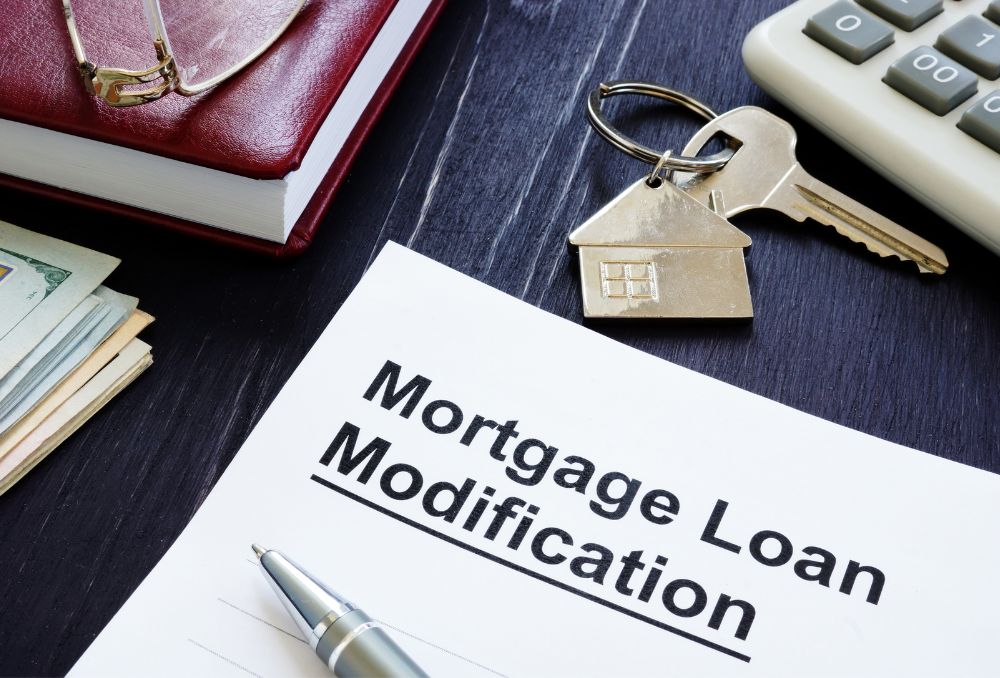
As foreclosure filings continue to increase to an average near 50% higher than the pre-pandemic years (2019 and earlier), struggling homeowners and landlords will need to focus on solutions such as loan modifications, forbearance agreements, short sales, and quick sales for cash. As an investor in the near future, you will likely find more deals readily available to choose from if you know where and how to look for them.


ADVERTISEMENT


Some metropolitan regions like Houston have 56% higher foreclosure rates. Other places like Minneapolis/St. Paul saw +106% foreclosure rates in March. Nashville was +35% higher and Phoenix + 33% higher in May; Rhode Island was up 32% in May.

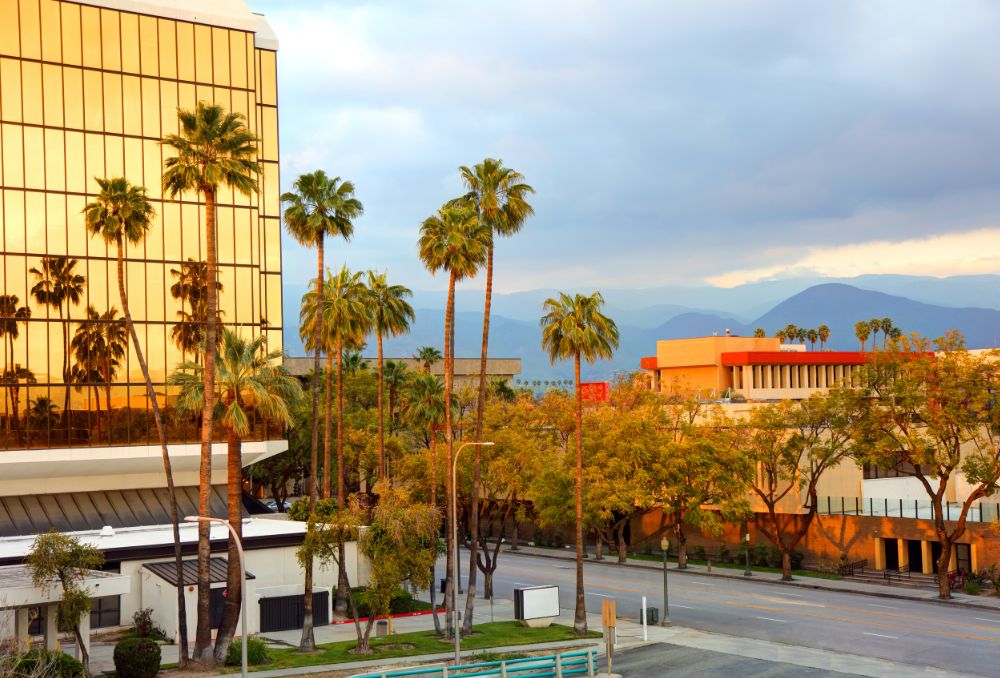
During the depths of the Credit Crisis / Great Financial Recession years between 2008 and 2013, California was hit the hardest with a -41% home price drop average from peak to trough. Nevada, Arizona, and Florida weren’t too far behind.

Some California home prices have risen as much as +41% over a period of just 18 to 24 months in recent years, so an equivalent -41% price drop is easier to imagine as some values may drop back towards 2021 levels.

The typical home today is about $80,000 higher than it was just two years ago. The average monthly rent payment today is more than $1,000 higher than it was in 2020. Middle-income first-time buyers are unable to afford 70% of homes. As California unemployment rates continue to rise at a faster pace than most other states (Big Tech layoffs, especially), it will be more challenging to continue making mortgage payments.

Rental Market Trends

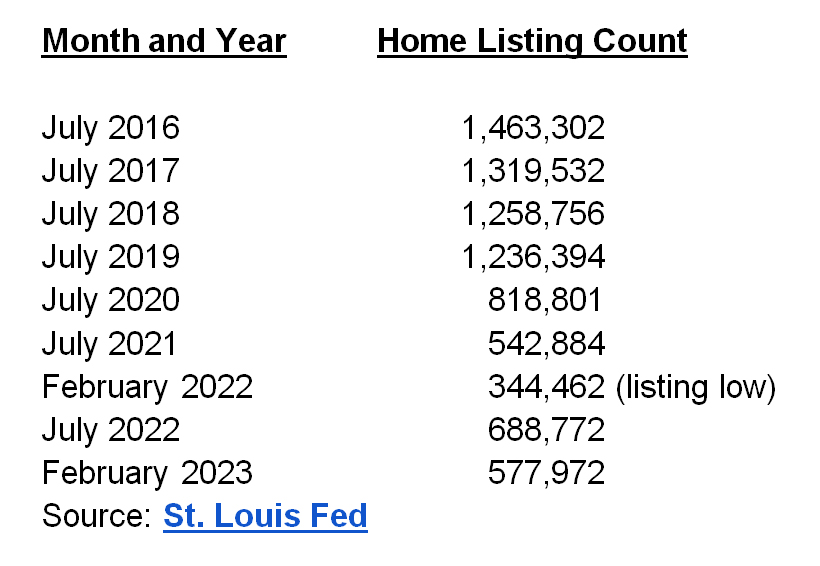
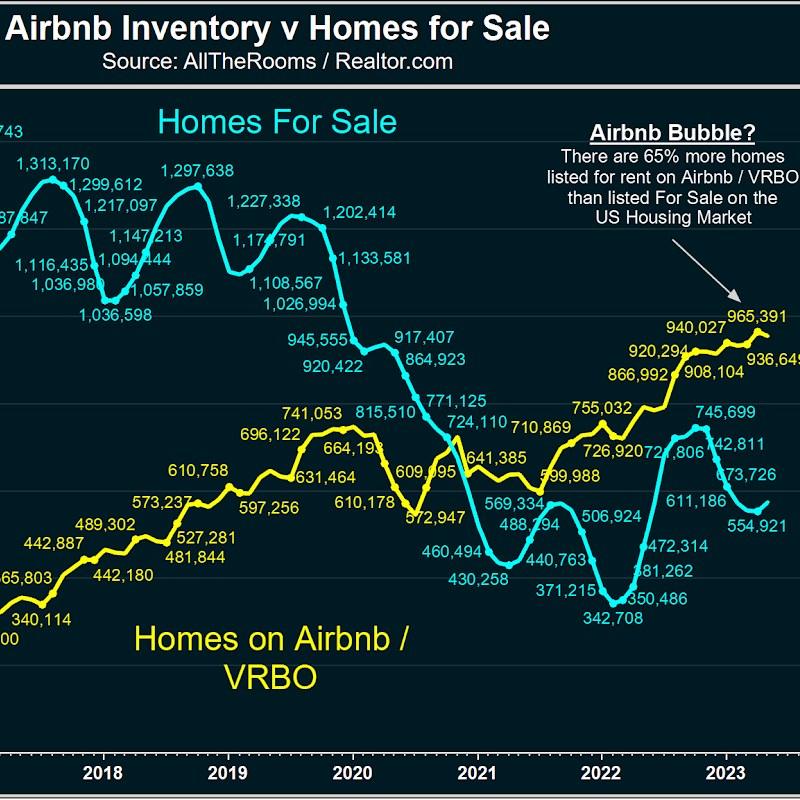
Today, there are 65% more active short-term rental listings on Airbnb and VRBO (965,000+) than all homes listed for sale nationally (554,000+), as per Realtor.com and other sources. At some point, the vacant short-term rentals will become listed homes for sale or distressed properties due to higher vacancy rates.

Ironically, the founders of Airbnb originally used air mattresses to cover their own San Francisco apartment unit’s rent. Eventually, air bubbles go pop one way or another.

Rent Increases

The following metro areas have experienced the greatest year-over-year rental price percentage increases through May 2023:
Providence-Warwick, RI-MA (+17.44 percent)
Kansas City, MO (+13.20 percent)
Minneapolis-St. Paul-Bloomington, MN-WI (+8.97 percent)
Raleigh-Cary, NC (+8.05 percent)
Charlotte-Concord-Gastonia, NC-SC (+7.65 percent)
San Jose-Sunnyvale-Santa Clara, CA (+7.59 percent)
Hartford-East Hartford-Middletown, CT (+7.47 percent)
Columbus, OH (+6.81 percent)
Los Angeles-Long Beach-Anaheim, CA (+6.20 percent)
Riverside-San Bernardino-Ontario, CA (+5.97 percent)

Rent Decreases

The following metro areas have experienced the largest year-over-year rental price percentage decreases through May 2023:
Austin-Round Rock-Georgetown, TX (-20.76 percent)
New Orleans-Metairie, LA (-20.42 percent)
Las Vegas-Henderson-Paradise, NV (-10.57 percent)
Houston-The Woodlands-Sugar Land, TX (-8.42 percent)
Seattle-Tacoma-Bellevue, WA (-8.28 percent)
Cincinnati, OH-KY-IN (-6.49 percent)
Phoenix-Mesa-Chandler, AZ (-6.46 percent)
Birmingham-Hoover, AL (-5.98 percent)
Memphis, TN-MS-AR (-4.85 percent)
Oklahoma City, OK (-4.44 percent)
Source: Rent.com

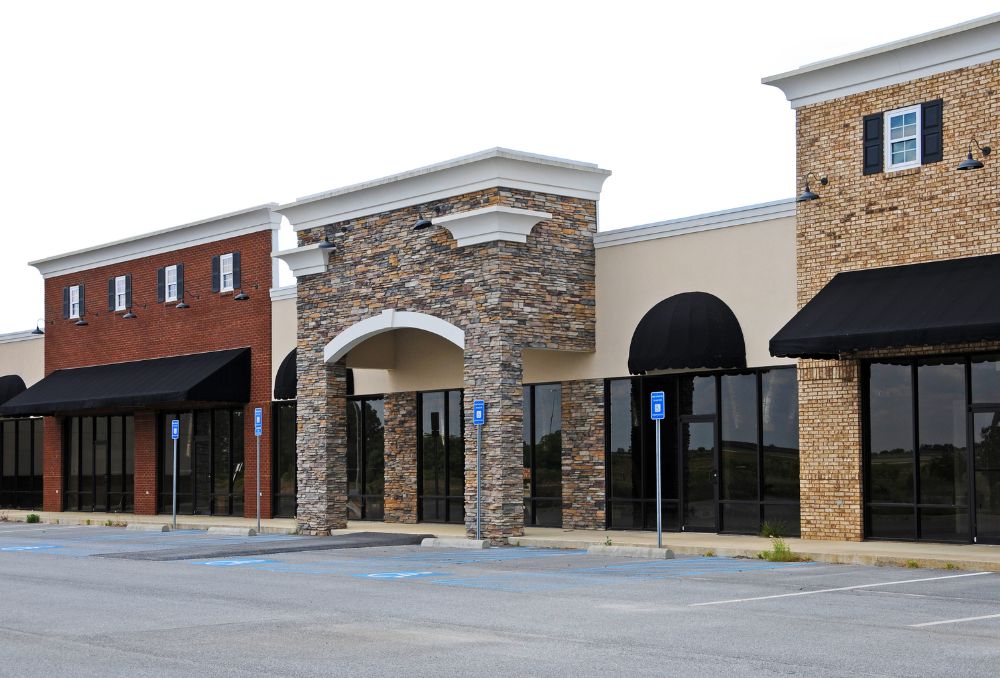
Multifamily Trends in Southern California

Sales and prices for multifamily apartment buildings have started to really fall in Los Angeles and other metropolitan regions across the nation. Specifically within Los Angeles, the number of units fell 11% in the first quarter of 2023 as compared with the previous fourth quarter in 2022. More shockingly, multifamily apartment building prices collapsed by -37.5% year-over-year as per a report shared by NAI Capital.

During the same first quarter time period, the average sales price per apartment unit dropped by 18.4%. One major factor for the falling price and sales volume numbers for Los Angeles County was directly related to the Measure ULA “mansion tax” that affected both luxury homes and commercial real estate properties priced above $5 million as of April 1st.

While $5 million may seem pricey for a luxury home in Los Angeles or elsewhere, the same $5 million dollar price tag for a rather small multifamily apartment building is much more common.


ADVERTISEMENT


Strangely, both vacancy rates and apartment rents continue to rise together at the same time in many parts of Los Angeles and elsewhere. Average rents rose to $2,156 per apartment unit in Los Angeles, a +1.9% year-over-year increase.

Some regions of Los Angeles had more negative rent, sales price, and vacancy trends. For example, the first quarter numbers for these Los Angeles multifamily submarkets were more negative than positive and were as follows:

  • San Fernando Valley and Santa Clarita Valley: The average multifamily sale price per unit fell by -35.9% year-over-year while the vacancy rates increased by +22%.
  • San Gabriel Valley: The average sales price per unit decreased by -20.3% while vacancy rates skyrocketed by +32.2%.
  • L.A. Westside: The average sales price per unit fell by -9.5% while vacancy rates increased by +10.7%.

Historically, rising vacancy rates and rental payment trends are usually inverse to one another like a seesaw with payments falling as vacancy rates rise. We shall see how long this trend lasts.

A very high number of landlords haven’t collected a rental payment for two or three years either, especially in Los Angeles County. When will the foreclosure and tenant eviction rates really begin to accelerate and adversely impact both tenants and landlords?

The Locked-In Homeowner and Unlocked Treasures

There are upwards of 16 to 20 million vacant or distressed properties across the nation. Additionally, there are millions of distressed FHA mortgages alone. Many homeowners haven’t made a mortgage payment for more than three years just like so many tenants.

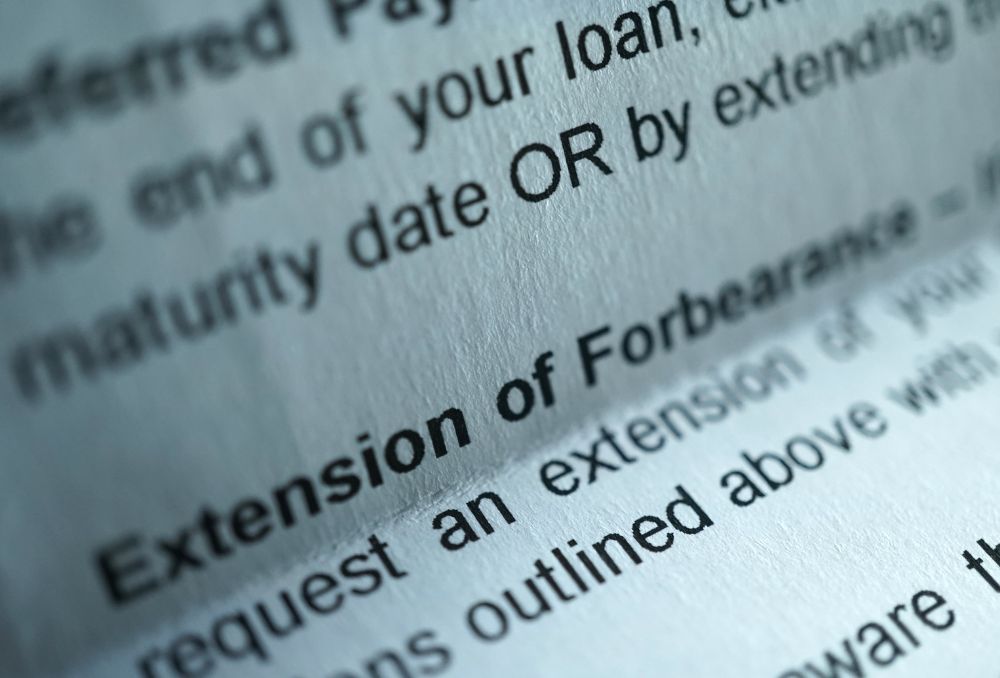
Loan modifications, forbearance, and loan forgiveness plans continue at near record paces across the nation. Lenders are not filing foreclosure as aggressively as they would have in years past, partly due to ongoing pandemic restrictions in place. This is a major reason why the national home listing inventory supply is so low.

Another reason why there are so few homes listed for sale is because upwards of 92% of homeowners with a mortgage have an existing rate at or below 6%, as per a study released by Redfin. Let’s take a quick look below at the fixed rate estimates for homeowners as of the first quarter:

  • 91.8% of mortgaged homeowners have rates below 6%.
  • 82.4% of homeowners have rates below 5%.
  • 62% of homeowners have rates below 4%.
  • 23.5% of homeowners have rates below 3%.

It can be rather challenging for a homeowner to consider losing their 6%, 5%, 4%, 3%, or even 2% fixed rate mortgage with a 30-year term and move to another home with a rate closer to 7% or 8%. As a result, it’s referred to as the “lock-in effect” because so many homeowners don’t want to lose their near record rate locks.

The market may change for the better or worse later this year depending upon a few factors such as follows:

First, will future unemployment trends improve or get worse. A loss of income is generally the #1 reason why someone loses their home to foreclosure.

Second, will lenders and loan service companies start to file foreclosure notices at a much faster pace than in recent years?

Third, will tenant protections in place be eased up or tightened? Most landlords are small investors who may be fortunate to own just one or two rental properties. After months or years of no rent collected, the landlords may be at risk of losing their rentals and primary home to foreclosure.

Your key to future success that unlocks your potential as either a homeowner, investor, or tenant is to focus on the positives and negatives while minimizing your risk and maximizing your gains. With the right mindset and guidance, it will be akin to a literal key that unlocks a treasure chest!!!


Rick Tobin

Rick Tobin has worked in the real estate, financial, investment, and writing fields for the past 30+ years. He’s held eight (8) different real estate, securities, and mortgage brokerage licenses to date and is a graduate of the University of Southern California. He provides creative residential and commercial mortgage solutions for clients across the nation. He’s also written college textbooks and real estate licensing courses in most states for the two largest real estate publishers in the nation; the oldest real estate school in California; and the first online real estate school in California. Please visit his website at Realloans.com for financing options and his new investment group at So-Cal Real Estate Investors for more details. 


Learn live and in real-time with Realty411. Be sure to register for our next virtual and in-person events. For all the details, please visit Realty411.com or our Eventbrite landing page, CLICK HERE.

The Unaffordable Housing Crisis

By Rick Tobin

Can it be true that finding homes to live in using creative seller-financed transactions may soon become easier and more affordable than qualifying to lease or purchase a home with traditional financing options?

The typical home today is about $80,000 higher than it was just two years ago. The average monthly rent payment today is more than $1,000 higher than it was in 2020. Middle-income first-time buyers are unable to afford 70% of homes.

To qualify as a tenant, many landlords require that the tenant applicant’s income be three times the proposed monthly rent. In California where some average rents are $3,000 to $5,000 per month, the qualifying household income would need to be somewhere between $9,000 and $15,000 per month. Additionally, a significant deposit and the paying of at least one month’s rent upfront can be challenging for many tenant applicants.

Most Expensive Home Regions

San Diego is ranked as the #1 most expensive housing market in the nation, as per this U.S. News report. In more recent times in late 2022 and early 2023, San Diego’s home price-to-household income ratio almost reached an average of 15x (15 times), which is three times higher than the national average of 4x or 5x.

“In April 2023, the median listing home price in San Diego, CA was $999K, trending up 6.3% year-over-year. The median listing home price per square foot was $698. The median home sold price was $877K.” Realtor.com

The main criteria for this Top 10 ranking of the most expensive cities in the nation included the median home price and average salary. In spite of using 2021 household price data, this analysis was recently published in May 2023 and is used as a forecast for the 2023 to 2024 years.

1. San Diego, CA

Average median home price 2021: $889,225
Average salary: $67,200

2. Los Angeles, CA

Average median home price 2021: $807,498
Average salary: $63,056

3. Honolulu, HI

Average median home price 2021: $581,658
Average salary: $61,860

4. Miami, FL

Average median home price 2021: $490,162
Average salary: $54,790

5. Santa Barbara, CA

Average median home price 2021: $464,954
Average salary: $62,020

6. San Francisco, CA

Average median home price 2021: $1,082,875
Average salary: $86,590

7. Salinas, CA

Average median home price 2021: $986,702
Average salary: $56,350

8. Santa Rosa, CA

Average median home price 2021: $828,156
Average salary: $64,080

9. San Juan, Puerto Rico

Average median home price 2021: Not Available (N/A)
Average salary: $31,650

10. Vallejo & Fairfield, CA

Average median home price 2021: $562,567
Average salary: $64,270

The ranking of Santa Barbara, California as #5 is a bit confusing because of the incredibly low median home price that is listed for this region. This data count estimate must take into consideration inland properties that are very far away from the ocean. Homes near the beach in this beautiful region are closer to $2 to $20 million.

Rising Household Income Requirements

Data provided by the California Association of Realtors (20% down payment and 30% front-end DTI or debt-to-income ratio estimates) for the following Southern California counties shows us how ridiculously high the household income requirements now are to purchase a median (or middle) price home based upon the rising mortgage rate trends:

Ventura County: A$205,200 household income is required to purchase an $828,750 home.

Los Angeles County: A $185,200 household income is needed for a $746,750 home.

Orange County: A $296,400 household income is required for a $1.2 million dollar home.

Riverside County: A $148,000 household income is needed for a $597,000 median home price.

San Bernardino County: A $115,200 household income would be needed to purchase a $464,500 home.

Please note that these “median” home prices are right in the middle of the county home averages. For properties close to the Pacific Ocean, the home prices may be 2, 3, 5, 10, 15, or 20+ times higher.

The average owner-occupant in recent years has used just 6% as a down payment instead of the 20% down payment number used for this California Association of Realtors (CAR) estimate. As a result, it’s more likely that the average loan amount for each borrower would be higher and also require mortgage insurance for loans above 80% loan-to-value (LTV). If so, the qualifying household income would probably be much higher than what’s listed on this county forecast estimate provided.

Disappearing Homeowners Insurance

In California, both State Farm and Allstate announced that they will no longer offer new homeowners insurance policies. In recent times, Geico closed down all of their California offices and Progressive stopped advertising in the state. The California FAIR Plan with limited coverage and higher costs than other plans, which is considered the last resort option for homeowners who can’t seem to qualify for other insurance plans, just announced another nearly 50% hike for their annual premiums.

Florida (#1 most expensive homeowners insurance state), Louisiana, Texas, and many other states are tightening up their insurance policy requirements as well or pulling out of these states, so it’s not just happening here in California. Some homeowners insurance policies in Florida are three or four times higher than the national average near $1,800 due to the extreme flood and weather risks there.

Right now, many insurance companies are focused more on not writing new homeowners insurance policies. What happens when some of them later change these restrictions to not allow the renewal ofactive policies?

More than 70% of all homes in California have a mortgage (lenders require active insurance in place to protect their interests also), which is higher than the national average. With fewer insurance plan options available, an increasing number of homeowners will be inspired to sell here in California, Florida, and elsewhere while pushing the listing inventory supply higher.


ADVERTISEMENT


Declining Purchasing Power for the Dollar

It’s not Americans “spending too much” that’s causing record inflation. Rather, it’s the combination of the record printing of dollars and the skyrocketing government debt spending that’s crushing the purchasing power of our dollar while making housing increasingly unaffordable to lease or purchase.

Generally, the loosening or tightening of the money supply is the root cause of periods of extreme inflation or deflation. For example, the M1 (cash, checking, etc.) money supply went from $4 trillion in January 2020 to $20 trillion in October 2021 in just 22 months. As the supply of new money reached the economy, the purchasing power of the dollar rapidly declined and fewer goods, services, and assets could be purchased with the same dollars as I’ve shared before.

Paying Loans Back

At some point, debts have to be paid back if the borrower doesn’t plan on filing for bankruptcy. This is true whether it’s an individual or a billion-dollar corporation with two billion in massive debt.

After more than three years of deferred student loan payments due to the pandemic declaration, millions of consumers will be faced with the reinstatement of monthly payment obligations for student loans starting in late August 2023.

Unpaid student loan debt reached more than $1.75 trillion and automobile loans surpassed $1.55 trillion by April 2023. It’s a $393 per month average payment for student loans. There’s another $1 trillion for all unpaid credit card debt at a 24% rate average.

Consumer spending usually represents about 70% of the US GDP (Gross Domestic Product). Student loans equal 7% of GDP. Approximately 64% of the $1.7 trillion in student loan debt has been in forbearance for the past three years, which equates to $1.1 trillion.

Millions of other homeowners haven’t made a monthly mortgage payment as well as far back as 2020. At some point in the future, mortgage lenders or loan service companies will also require the collection of monthly payments with or without a forbearance or loan modification plan in place.


ADVERTISEMENT


New FHA Bailout Loan Proposal

It appears that FHA is proposing a 0% interest 2nd loan bailout for the millions of their distressed mortgage borrowers who may be months or years behind in their payments. It’s called the Payment Supplement Partial Claim.

The previously proposed FHA bailout solution offered was a loan modification option which would have doubled or tripled the homeowner’s current rate while not dropping their payments at all. Again, there are millions of distressed FHA loans nationwide that are months or years behind.

Preparing for New Opportunities

As I shared in my previous article entitled A 33-to-1 Vacant & Distressed Home-to-Listed Home Ratio, there are potentially upwards of 18 to 20 million vacant (abandoned, 2nd, and rental homes) or distressed homes in the nation. If just a relatively small percentage of these homes are listed for sale or go into foreclosure, it may more than double or triple the national home listing supply while driving home prices downward.

If and when mortgage rates and other forms of consumer debt rates continue to rise right alongside the national home listing supply, an increasing number of sellers will welcome the creative seller-financed transactions that I share with my So-Cal Real Estate Investors Club members and with my real estate course students across the nation.

For example, how would you like to purchase a home with a minimal down payment, no formal loan qualification, and take over a 2.75% fixed mortgage rate payment that’s lower than a nearby rental?

Now is the best time to learn about creative real estate investment strategies that very few people truly understand well before the housing market begins to change direction yet again. Denial is no longer an option. If you’re the first person to go in a different direction than your competition, you’re more likely to be the first person to succeed due to your preparation.


Rick Tobin

Rick Tobin has worked in the real estate, financial, investment, and writing fields for the past 30+ years. He’s held eight (8) different real estate, securities, and mortgage brokerage licenses to date and is a graduate of the University of Southern California. He provides creative residential and commercial mortgage solutions for clients across the nation. He’s also written college textbooks and real estate licensing courses in most states for the two largest real estate publishers in the nation; the oldest real estate school in California; and the first online real estate school in California. Please visit his website at Realloans.com for financing options and his new investment group at So-Cal Real Estate Investors for more details. 


Learn live and in real-time with Realty411. Be sure to register for our next virtual and in-person events. For all the details, please visit Realty411.com or our Eventbrite landing page, CLICK HERE.

A 33-to-1 Vacant & Distressed Home-to-Listed Home Ratio

By Rick Tobin

Why are you just searching for listed properties for sale when the number of distressed, vacant, and “shadow inventory” homes is almost 33 times larger than the national home listing inventory supply?

How is this possible with my 33 number claim? First, upwards of 16 million homes were listed as “vacant” or shadow inventory in the fourth quarter of 2022, as per the U.S. Census Bureau, National Association of Realtors (NAR), and other groups. A vacant home can be defined as a vacation home, unsold new home building inventory (near record levels of new single-family homes and multifamily apartment buildings being built in 2023), distressed or pre-foreclosure properties, or homes held by billion-dollar corporations like BlackRock, Blackstone, or State Street for the long-term that just sit there with no intent to rent it out at present.

Second, there are at least a few million distressed mortgages (FHA loans, especially) currently in forbearance agreements in order to delay the lender’s foreclosure filing actions to bring the total to more than 18.5 million properties. Frankly, I think that the number is closer to 20 million after counting VA, conforming, non-QM, and private money loans, but we’ll just focus on the 18.5 million vacant or distressed home number.

Since 1934, FHA (Federal Housing Administration) has insured more than 40 million loans nationwide. Today, a relatively high percentage of homebuyers still rely upon FHA to purchase their homes partly due to the much lower interest rates and easier loan qualification guidelines such as loan programs which allow FICO credit scores as low as 500, debt-to-income (DTI) ratios up to 50% or higher, and loan-to-value (LTV) options near 96.5% to 100% LTV.

As of March 2023, the national home listing inventory was listed at 562,565 by data provided by the Federal Reserve Economic Data and the NAR. Let’s do the math as follows:

18.5 million distressed or vacant homes / 562,565 listed homes = 32.885 times


ADVERTISEMENT


Distressed FHA Loans & Continued Forbearance Extensions

There are three to four times as many delinquent FHA mortgage loans nationwide as compared to the entire national home listing inventory with somewhere near at least a few million distressed FHA loans.

February 8, 2023: Today, the U.S. Department of Housing and Urban Development (HUD) Secretary Marcia L. Fudge announced that, thanks to Federal Housing Administration (FHA) programs, approximately 2 million homeowners with FHA mortgages were able to stay in their homes from the beginning of the COVID-19 pandemic in March 2020 through December 2022 – when doing so was often a matter of life and death. During this period of time amid the pandemic, FHA borrowers whose ability to make their mortgage payments was impaired by the pandemic were able to obtain either a COVID-19 forbearance or a more permanent solution such as a loan modification that allowed them to avoid foreclosure.
Source: HUD Secretary Announces Major Milestone of Assisting Nearly 2 Million Homeowners Stay in their Homes

With a few million distressed FHA loans that they admit to and is probably undercounted, it’s no wonder why the federal government wants to keep offering FHA forbearance extensions.

Details of FHA’s COVID-19 Forbearance

Important information about FHA’s COVID-19 Forbearance:

To be eligible for the COVID-19 Forbearance or forbearance extension in the table above, you must request this relief from your servicer on or before May 31, 2023.

You can request a FHA COVID-19 Forbearance for up to 6 months. If needed, an additional 6 month extension may be requested. If you began your initial forbearance on or after October 1, 2021, you are only eligible for the additional 6 months if your initial 6 months forbearance will be exhausted and expires on or before May 31, 2023.

Additional forbearance options may be available to you after May 31, 2023. Your mortgage servicer may provide for a temporary pause or reduce your monthly mortgage payments to allow you time to overcome your financial hardship. An extended forbearance period may be provided to you if you are unemployed and actively seeking employment.

No extra fees, penalties, or interest will be added to your account during the forbearance period.

Source: U.S. Department of Housing and Urban Development (HUD)

There are also a significant number of distressed VA and conforming or conventional loans nationwide which are held by Fannie Mae or Freddie Mac in the secondary market that aren’t really being “officially” counted with the most up to date numbers. FHA and VA mortgage loans have both consistently represented close to 10% each of the annual national funded loan market. As a result, these government-backed or insured loans, which typically average close to 0% to 3.5% down payments for FHA, VA, and conforming, are something to keep a close eye on as the economy continues to soften.

The 40-Year Loan Modification Program for FHA Borrowers

Good news: National mortgage delinquency rates dropped 15% in March 2023 while reaching 2.92%, which was a new all-time record low.

Bad news: Millions of distressed mortgages are not being counted as “delinquent” once they enter forbearance agreements with their lender (FHA loans, especially). The national FHA loan default rate reached 12% in February and will likely continue to rapidly increase. Distressed FHA and VA loan investments are some of the best deals out there because they usually have the lowest mortgage rates that you can take over by way of creative seller-financing techniques.

A forbearance agreement is when the lender or mortgage loan servicing company agrees to postpone or delay their foreclosure actions with the delinquent borrower. Sometimes, these foreclosure postponements may last months or years.

On March 8, 2023, HUD issued their Mortgagee Letter 2023-06 with details described as the “Establishment of the 40-Year Loan Modification Loss Mitigation Option” with a stated purpose noted as “This Mortgagee Letter (ML) establishes the 40-year standalone Loan Modification into FHA COVID-19 Loss Mitigation policies.”

Several mainstream media analysts mistakenly described this new 40-year loan proposal offered by FHA as a purchase loan as well. Yet, this is not correct because it’s only for the refinance of currently distressed 30-year FHA loans into longer 40-year loan terms in order to reduce the monthly payments for borrowers. There is no published word about whether FHA will later consider offering 40-year purchase loans for borrower prospects.

Housing and Family Trends

Real estate is a people business, first and foremost. The #1 most important factor for housing trends is related to population trends and household formations for families especially. Without people, there’s no need for housing regardless of the affordable financing offered.

One of the main reasons why people purchase single-family homes is because they’re trying to either build a growing family or the need to house two or three generations of the family under the same roof. You can’t spell “single-family homes” without family in it.

The U.S. has the highest percentage of one-person households in the entire world. A few years ago, one-person households surpassed all other household formations in Canada.

In 2022, only 24% of U.S. households had at least one child under the age of 18. In 1965, upwards of 42% of households had a child under the age of 18.

The Decline of Family Households

Here are some of the published data numbers from sources such as the U.S. Census Bureau, the National Center for Health Statistics (NCHS), Pew Research, and numerous other data sources in regard to individuals and family structure trends:

  • National overall divorce rate in the USA: 50%+.
  • The California divorce rate is 60%.
  • The Orange County, California divorce rate is 72%.
  • 41% of first marriages nationwide end in divorce.
  • 60% of second marriages end in divorce.
  • 73% of third marriages end in divorce.
  • The average length of a marriage in the U.S. that ends in divorce is 8 years.
  • There is one divorce every 36 seconds in the U.S. on average; 2,400 divorces per day; 16,800 divorces per week; and 800,000 to 900,000 divorces per year.
  • The percentage of American men between the ages of 20 and 39 who are now married has fallen by half (35% of men are married as of 2017) since the early 1970s (70% of men were married).
  • Unmarried parents who live together are more likely to break up than married parents, per the Brookings Institute.
  • Per the CDC in 2016 through at least 2020, U.S. fertility rates were the lowest ever recorded as fewer couples are having children these days. Each consecutive year over the past five or six years reached all-time record lows.
  • 78% of all households in the U.S. contained one married couple in 1950. Today, married households are below 48%.
  • In 2010, the Pew Research Center reported that 44% of Americans polled in the 18-to-29 year old age range believed that “marriage was becoming obsolete.”
  • Divorce rates for people over the age of 50 have doubled between 1990 and 2015, per Pew Research Center.
  • In 1956, roughly 5% of all babies were born to unwed mothers. Between 2008 and 2016, babies born to unwed mothers were closer to the 40% range.
  • Upwards of 50% of children in impoverished regions of the U.S. live in homes without fathers.
  • 46% of children live at home with a mother and father who were in their first marriage together.
  • The average American woman in 1970 had her first child at 21.4 years of age. Today, the woman is near 25.6 years of age.
  • The U.S. has the highest teen pregnancy rate in the industrialized world.
  • More than 50% of children are born to unmarried women under the age of 30.

Saving Equity or Creating Newfound Wealth

What are your options as either a homeowner with an ongoing forbearance agreement in place with your lender, a struggling business owner, a commercial property owner and landlord with incredibly high vacancy rates, or as an investor seeking new opportunities if and when the economy suddenly pivots and we enter a more clearly visible deeper recession? If home values are more likely to be higher today than later this year, is it now a good time to sell? If so, where will be your next destination for a home?

Generally, loss of income is the #1 reason why homeowners lose their homes to lenders or mortgage loan service companies in foreclosure. The #2 reason why homeowners walk away from their home is when the mortgage debt exceeds the current market value and it’s upside-down or underwater. This is when short sale options become more prevalent.


ADVERTISEMENT


The real risk associated with homes purchased in recent years is related to the relatively low down payment averages for first-time buyers and others that were leveraged between 96.5% and 100% loan-to-value at the close of escrow. Effectively, these homebuyers were upside-down with negative equity at closing when factoring in the potential 6% to 8% closing costs to resell the homes after paying real estate brokerage commissions, title, escrow or attorney’s fees, transfer taxes, third-party inspection reports, and possible seller credits towards the buyer’s closing costs.

In 2022, first-time homebuyers represented 34% of all home purchases across the nation, as per the NAR. During the fourth quarter of 2022, purchase loans comprised 78.6% of all FHA mortgages funded. With a high percentage of FHA borrowers reported as first-time homebuyers, their average down payments were likely close to 3.5% or below. What happens if home values fall 5%, 10%, or more in value over the next year?

If you’re currently in a distressed mortgage situation as a homeowner or investor or are searching for discounted off-market listings as a buyer with very creative and flexible financing solutions, I can show you effective ways to save your equity or create newfound wealth with my mortgage and investment business named Realloans (Real Estate Loans and Creative Sales) and my real estate group linked here: So-Cal Real Estate Investors.


Rick Tobin

Rick Tobin has worked in the real estate, financial, investment, and writing fields for the past 30+ years. He’s held eight (8) different real estate, securities, and mortgage brokerage licenses to date and is a graduate of the University of Southern California. He provides creative residential and commercial mortgage solutions for clients across the nation. He’s also written college textbooks and real estate licensing courses in most states for the two largest real estate publishers in the nation; the oldest real estate school in California; and the first online real estate school in California. Please visit his website at Realloans.com for financing options and his new investment group at So-Cal Real Estate Investors for more details. 


Learn live and in real-time with Realty411. Be sure to register for our next virtual and in-person events. For all the details, please visit Realty411.com or our Eventbrite landing page, CLICK HERE.

The Interconnected California & Global Real Estate Markets

By Rick Tobin

Did you know that the median Southern California and statewide home prices have fluctuated between the $750,000 and $850,000 range over the past year? Generally, the housing price-to-household income for California has varied between 8x to 10x (times or multiplied) for home prices as compared to the qualifying household income. For example, a home with a purchase price of $800,000 is 10 times (10x) the combined household income of $80,000.

While California is usually one of the most expensive places in America to own or lease a property, it’s still “affordable” in comparison to these Top 10 most expensive home price-to-household income locations on the planet which are as follows:

#1 Shanghai, China – 46.6x
#2 Beijing, China – 45.8x
#3 Hong Kong, China – 44.9x
#4 Colombo, Sri Lanka – 43.7x
#5 Beirut, Lebanon – 41.3x
#6 Shenzhen, China – 40.1x
#7 Manila, Philippines – 37.6x
#8 Guangzhou, China – 37.3x
#9 Mumbai, India – 36.6x
#10 Ho Chi Minh City, Vietnam – 34.5x
Source: Numbeo – Property Price Index 2023

The Top 10 priciest home regions have both skyrocketing home prices and annual wages that are extremely low which makes California and the rest of our nation seem reasonably priced when reviewing home price-to-income ratios.

The California economy is now the 5th largest economy in the world. Our economy is on a growth pace that may soon make it the 4th largest economy if our state surpasses Germany. We attract investors and new residents from around the world such as from Asia, Europe, Mexico and Latin America. In fact, there are more Hispanics or Latinos in California as of 2015 than any other race or ethnicity.

The Southern California (So-Cal) region within our state consists of upwards of 24 or 25 million residents located in 10 counties which include: Imperial, Kern, Los Angeles, Orange, Riverside, San Bernardino, San Diego, Santa Barbara, San Luis Obispo, and Ventura.


ADVERTISEMENT


So-Cal and U.S. Real Estate Trends

In the So-Cal Real Estate Investors – Canyon Lake group that I lead, we discussed the following real estate and financial topics at our latest in-person meeting at Canyon Lake Golf & Country Club on April 18th, 2023:

1. Home values over the next year could fall, be flat, or even increase if the Fed is forced to pivot and start rapidly cutting rates again. Be prepared for any and all investment possibilities and opportunities.

2. Home equity represents the core wealth: The bulk of a homeowner family’s overall net worth comes from the equity in their primary residence. The average US homeowner at retirement age has approximately 83% of their overall net worth tied up in the equity in their home and pays monthly expenses from the remaining 17% of overall net worth that’s held in checking, savings, or pension accounts.

3. Riverside-San Bernardino-Ontario, CA Metro Area (March 2023)

  • Home Value: $542,000
  • Median Household Income: $77,095
  • Home Price to Household Income Ratio = 7.03x (5x is national avg.)
  • Home Value Growth (Year-over-Year or YoY): 3.0%
  • For Sale Inventory: 7,511
  • Sales Inventory Growth: 71.1% YoY
  • Price Cut Share of Listings: 16.8%
  • Rent for Apartments: 2,494/mo.
  • Monthly House Payment: $3,426 (PITI)
  • Rent for Homes: $3,243/mo.
  • Monthly Difference Between Home Mortgage and Rent: $183
  • Listing Inventory as % of All Homes: 0.5%
    Sources: Realtor.com, Zillow, and US Census Bureau

“The difference between monthly mortgage payments and rents hasn’t been this big since 2006, around the peak of the housing bubble that led to the Great Financial Crisis, according to the National Multifamily Housing Council. Assuming a 10% down payment, the group found that a monthly payment on a 30-year fixed-rate mortgage was $1,176 more than renting an apartment up to the end of 2022. The buy-to-rent premium hasn’t been this steep since the third quarter of 2006.” – Business Insider

The exception to this current massively widening mortgage payment-to- rent trend is Riverside Metro with only a $183 monthly price difference.

4. Lack of a sufficient down payment is the most common reason why an individual or family can’t qualify to purchase a home unless they can qualify for a VA loan or even FHA loan with $0 down after factoring in seller credits and gift money. There are at least 311 down payment assistance (DPA) programs available to California residents and upwards of 2,300 DPA programs available nationwide, as per the Down Payment Resource group. Yet, many people are only familiar with the California Dream DPA program that had $300 million already committed to buyers in just the first 11 days before it shut down. Originally, the plan was for California to offer first-time buyers up to $500 million, but the state had to use $200 million of those earmarked funds to cover other budget deficits.

5. Short-Term Rentals: Coachella Valley had the highest March/April 2023 ADR (Average Daily Rent) of the top 50 short-term rental markets partly due to the Coachella and Stagecoach music festivals; U.S. short-term rentals earned over $62 billion in revenue in 2022, which was a 25% year-over-year increase; San Diego was the most profitable Airbnb metropolitan region in the world in 2021; Big Bear City was ranked #8 in the entire world for highest-grossing Airbnb revenue in 2020; and Moreno Valley was the most profitable Airbnb city in the U.S. in 2019.

Investors can qualify with as little as 15% cash down using DSCR (Debt Service Coverage Ratio) programs where the current or proposed rents cover the proposed monthly mortgage payment (PITI and HOA, if applicable) on an EZ-Doc type of basis.

Flipping homes or paper: With even shorter term real estate options that may be be completed within hours or days, you can either flip properties or paper such as lease-options, wholesale purchase contract assignments, seller-financed notes or deeds, or partial income streams from beneficial or lender interests in the promissory note (“IOU for debt”) or trust deed.

6. Distressed mortgage and rental property data from 2021. Today’s 2023 numbers are probably significantly worse and rarely published.

  • An estimated 15 million people lived in households that owed more than $20 billion in unpaid rent as of July 2021.
  • 7.43 million rental property units were not current.
  • 5.95 million owner-occupied housing units weren’t current.
  • 8.71 million lived in owner-occupied homes where the homeowners have little or no confidence in their ability to pay their mortgage.
  • 12.71 million lived in rental properties where the heads of household had little or no confidence in their ability to pay their rent.
  • Serious mortgage delinquencies were up 20% in July from June and were the highest recorded since 2010.
  • By mid-August 2021, 3.9 million homeowners were in active forbearance, which represented 7.4% of all mortgages nationwide and $833 billion in total unpaid principal.
  • An estimated 11.6% of all FHA and VA loans were in active forbearance.
    Sources: U.S. Census Bureau and Black Knight Mortgage Monitor

7. 2023 Consumer Debt Data and Trends: It’s claimed that upwards of 15,000 cars are repossessed every single day here in the U.S. alone. Mortgage and all consumer debt and payment rates and fees all just hit record highs at the same time. Average DTI (debt-to-income) ratios for existing mortgage borrowers reached an all-time record 44% DTI and FHA defaults reached almost 12% in February 2023.

Average interest rates (March ‘23):
– Credit Card: 24.5%
– Used Cars: 14.0%
– New Cars: 9.0%

Meanwhile, we have record levels of debt:
– Total Household Debt: $16.5 trillion
– Auto Loans: $1.6 trillion
– Credit Card Debt: $986 billion
– Student Loans: $1.6 trillion

The interest on student loans has been suspended since 2020 due to Covid, but is set to resume later this year. How many defaults will happen?

8. Understanding Credit: FICO scores range from 300 to 850. The higher the score, the better the credit grade. The three main credit bureaus or credit reporting agencies (CRAs) include Experian, TransUnion, and Equifax. The credit scores are derived from the following factors:
● Payment history—35%
● Amount owed—30%
● Length of credit history—15%
● New credit—10%
● Types of credit used—10%

New Credit Score Models: The average American has a FICO credit score near 690. In October 2022, the Federal Housing Finance Agency (FHFA) announced the approval of a new credit score rating system named FICO 10T and VantageScore 4.0 for use by Fannie Mae and Freddie Mac. FICO 10T and VantageScore 4.0 will consider payment histories from rent, utilities, and telecommunication bills. Yet, a rental payment history can be very bad for tenants on Covid moratoriums with years of no payments.


ADVERTISEMENT


9. Generational Home Purchase Trends: Between 2015 and 2022, the Millennial generation was ranked #1 overall as the largest generation of home buyers and tenants. Now, Baby Boomers (born between 1946 and 1964) take back the lead as the #1 home buyers partly due to having more cash and equity available from other properties. Senior housing and reverse mortgage opportunities are rapidly increasing as well.

“Baby boomers now make up 39% of home buyers – the most of any generation – an increase from 29% last year. Generation Z now makes up 4% of buyers, with 30% of Gen Z moving directly from a family member’s home into homeownership. When relocating, all generations are moving farther distances, with younger boomers (ages 58-67) moving the greatest distance at a median 90 miles away.” – National Association of Realtors

10. Ballooning Commercial Loans: $270B of commercial real estate loans are set to mature in 2023, which is an all-time record for loan maturities. An estimated $900 billion in commercial property loan debt may come due within just the next two years. If so, upwards of $630 billion dollars’ worth of commercial loans may come due in 2024 which would be 2.333 times the all-time ballooning commercial record loan set this year. How will this potentially affect commercial property value trends?

For more details, please visit www.socalrealestateclub.com.


Rick Tobin

Rick Tobin has worked in the real estate, financial, investment, and writing fields for the past 30+ years. He’s held eight (8) different real estate, securities, and mortgage brokerage licenses to date and is a graduate of the University of Southern California. He provides creative residential and commercial mortgage solutions for clients across the nation. He’s also written college textbooks and real estate licensing courses in most states for the two largest real estate publishers in the nation; the oldest real estate school in California; and the first online real estate school in California. Please visit his website at Realloans.com for financing options and his new investment group at So-Cal Real Estate Investors for more details. 


Learn live and in real-time with Realty411. Be sure to register for our next virtual and in-person events. For all the details, please visit Realty411.com or our Eventbrite landing page, CLICK HERE.

Economic Extremes & Consumer Shock

By Rick Tobin

None of us have ever seen such wide-ranging extremes of economic and asset trends as we’ve seen over the past few years. In many ways, it’s like we’re on a giant yo-yo swinging wildly from side to side or on a bumpy roller coaster ride with wicked twists and turns that keeps moving onward for years at a time instead of over just a minute or two.

All of the economic jerking that we feel on a daily basis can be overwhelming. Some days we see very positive news which gives us hope for a bright future. Other days, the gloomy negative news can seem a bit shocking because much of these positive and negative economic data trends have never been experienced in past years or decades.

Let’s review some of the key economic data trends that swing from very bad to very good (or vice versa) in hours, days, weeks, months, or over the past few years:


ADVERTISEMENT


Home Price Changes

Nationally, home prices have risen consistently since 2011. Investor home purchases fell the most on record in the 4th quarter of 2022 at a whopping -46% decline pace. Home prices fell for six months in a row since peaking in July 2022 through the end of January 2023, according to the Case-Shiller U.S. National Home Price Index.

A booming home price example: A young family purchases a new starter home for $300,000 in January 2020 shortly before the global pandemic designation. That same home would’ve peaked at $435,000 in the summer of 2022 using the same Case-Shiller data trends. If so, the family gained $135,000 in newfound equity in just 18 months or so.

The most horrific housing crash in US history took place between the market peak in 2006 and 2012 when the national housing average fell – 27%. California’s home losses were much more extreme with the peak to trough bubble burst falling as much as -41%.

Between 2019 and peak prices near the summer of 2022, many regions had home appreciation percentages of somewhere between massive 50% and 100%+ gains. Future home losses will need to be significant and the worst ever in national history to turn recent home purchases negative.

For people who’ve owned their homes for many years or decades, they will be more likely to ride out any significant price drops in the future. However, buyers who purchased with anywhere between 0% and 5% down in recent years may soon go underwater with the mortgage debt surpassing the market value.

Year-over-year home sales fell between 37% and 47% in Southern California counties through January. As sales volume declines, home price drops tend to follow even if most sellers aren’t willing to do it at first because they want peak record high prices like last seen in 2022.

Fewer buyers means less competition for quality properties and may lead to home listing price cuts and increased closing cost credits from sellers to buyers.

Commercial real estate properties: Upwards of 50% of all commercial property mortgage debt is a floating or adjustable rate. Additionally, the cost to insure the interest rate cap derivatives contract that protects both borrowers and lenders from the increasing risks associated with rising rates has increased 10-fold for borrowers, as per the Wall Street Journal. As such, it’s a double whammy for commercial mortgage borrowers in that both their mortgage and insurance rates have skyrocketed over the past year. The commercial sector is still getting hit harder than residential.

Listing Supply

The St. Louis Fed and Realtor.com share data together which shows both the current and past history for single-family homes, townhomes, and condominiums across the nation at any given time. As with other products available for purchase, a lower supply of something like eggs or popular toys will likely lead to higher prices due to the demand exceeding the available supply. Conversely, an oversupply of a product and falling demand will cause prices to fall.

Let’s review the national home listing trends dating back to 2016:

The US Census Bureau recently published data for the 4th quarter of 2022 which showed that there were 15 million vacant housing units (homes, condos, and rental apartments).

Vacant “shadow inventory” homes that are NOT listed for sale absolutely dwarf the total number of listed homes nationwide by a significant multitude. This has been true since at least 2009. If just 5% or 10% of the “shadow inventory” homes suddenly changed to homes available for sale, it could double the size of the national listing supply. “Shadow inventory” homes can also include homes already foreclosed upon by banks or mortgage loan servicing companies that are not offered up for sale.

Mortgage Rates

Approximately 75% of all homes nationwide were purchased with mortgages in recent years. Almost every boom and bust housing cycle over the past 50+ years was directly related to mortgage rate trends.

Between April 1971 and September 2022, the average 30-year fixed mortgage rate was 7.76% as per Freddie Mac. Today’s rates for borrowers with average FICO scores near 690 have fluctuated between 7% and 8% in recent months. The main difference today is that mortgage balances are two, three, four, or five times larger than in decades past.

We’re in the midst of the fastest mortgage rate increase in US history. The Federal Reserve’s rate hikes at a record pace over the past year are likely to later pivot and become massive rate cuts at some point in the future like we saw shortly after the 2008 housing bubble burst.

For comparison purposes about rate hikes, the Fed increased rates 17 times between June 2004 and June 2006 while pushing rates from 1% to 5.25% over 24 months while much smaller rate hikes that were closer to .25% at a time. This was the catalyst for the housing bubble burst later as so many adjustable rate option-like pay ARM mortgages and HELOCs doubled or tripled in monthly payment amounts.

Between the 1st quarter of 2022 and the 1st quarter of 2023, we’re on pace to increase rates 4.25% just like during the 2004 to 2006 era while doing it in about half the time (12 months instead of 24 months).

As of July 2022, approximately 80% of all open residential mortgages nationwide were priced at a fixed 4% rate or lower as per CoreLogic. Approximately 40% of all US residential mortgages were financed or refinanced near peak lows in 2020 or 2021.

Key point: The Primary Mortgage Market Survey conducted by Freddie Mac found that 99% of all residential mortgages nationwide had existing fixed rates lower than the national fixed rate average during the first week of March 2023.


ADVERTISEMENT


Three years ago near the start of the “pandemic” declaration in March 2020, the 10-year Treasury yield hovered close to an incredibly low and rather spooky 0.666% yield. The 30-year fixed mortgage rate is tied to the directions of the 10-year Treasury yield. Today’s 10-year Treasury yield closed at 3.966% on March 6, 2023 by comparison, which was about 3.3% higher.

Historically, the 30-year mortgage rate pricing is about 1.7% over the 10-year Treasury yield (0.6630 + 1.7% margin = 2.363% 30-year fixed mortgage rate, approximately). Over the past year, the margin has widened considerably to 3% or 4% over and above the 10-year Treasury yield to arrive at the latest 30-year fixed mortgage. This widening of the margin was partly due to perceived worsening financial conditions and the Fed’s Quantitative Tapering strategies which included their attempt to sell off trillions of dollars’ worth of mortgage bonds in spite of their being few buyers.

As a result, the 30-year fixed mortgage rate skyrocketed faster than ever to reach somewhere between 6% and 8%, depending upon the borrower’s FICO score and other creditworthiness guidelines.

Mortgage Applications

The lowest mortgage application reading of the 21st century was reached as of the 1st quarter in 2023 due to rising rates. By comparison when mortgage rates were at or near all-time record lows, there were 23.3 million home loan applications completed by consumers, according to the Consumer Financial Protection Bureau.

M1 and M2 Money Supply

“M1 is the money supply that is composed of currency, demand deposits, other liquid deposits—which includes savings deposits. M1 includes the most liquid portions of the money supply because it contains currency and assets that either are or can be quickly converted to cash. However, “near money” and “near, near money,” which fall under M2 and M3, cannot be converted to currency as quickly.” – Investopedia

The federal government has not published data about M3 since 2006. Our national money supply trends are more of a factor for causing rising inflation or falling deflationary trends more so than consumer spending.

High

The M1 money supply from $4 trillion to $20 trillion between just January 2020 and October 2021.

Low

M2 is a measure of the money supply which includes cash, checking deposits, and other types of deposits that are easily convertible to cash such as CDs. Last year was the first time when bank deposits declined within the same year since 1948. This is partly why banks are finally starting to offer higher savings rates to attract more deposits because they’re running low on cash.

The M2 year-over-year growth swung from one extreme to another between 2020 and 2023. It peaked at a +26% year-over-year growth in 2021 and later collapsed to a -2% by early 2023. In the past, a negative M2 money supply that was contracting was a foreboding or ominous sign of an upcoming economic recession or severe depression like seen back in the 1920s.

The M1 and/or M2 money supply directional trends tend to mirror inflation or deflation trends. The more money that is created, the more likely that inflation will rise as well while pushing assets like stocks and real estate much higher. Conversely, a falling money supply can create a deflationary economic cycle when asset prices fall as well.

Savings: US savings rates reached an all-time record low by the 1st quarter of 2023.

Stocks

Let’s take a closer look at some key dates for the Dow Jones stock index to get a better understanding of how wildly stock prices have swung over the past three years:

The Dow Jones stock index fell from a peak high of 29,551.42 on February 12th to a market low of 18,213.65 on March 23rd in 2020, which is more than a 38% overall percentage loss in just over a month. Of the 10 all-time biggest daily point losses ever for the Dow Jones index, eight of these days took place in either February or March in 2020. By comparison, the then all-time daily Dow Jones point loss record for the infamous day that almost took down the global financial system back on September 29, 2008 was only a -777 daily point loss.

Month & Year / Daily Point Loss

#1: 03/16/2020 / -2997
#2: 03/12/2020 / -2353
#3: 03/09/2020 / -2014
#4: 03/11/2020 / -1465
#5: 02/27/2020 / -1191
#6: 02/05/2018 / -1175
#7: 02/08/2018 / -1033
#8: 02/24/2020 / -1032
#9: 03/05/2020 / -970
#10: 03/27/2020 / -915
Source: Standard and Poors (through 03/27/2020)

Consumer Debt

Mortgage and other consumer debt is at an all-time record high. Credit card debt is near $1 trillion with the highest rates and fees ever averaging over 20%.

Distressed or pre-foreclosure numbers are listed as “below historical averages” today partly due to existing Covid-19 moratoriums. However, the true number of distressed properties that do not have foreclosure filings may later be on pace to reach peak 2008 to 2012 numbers and will likely be led by FHA mortgage defaults (95% to 96.5% LTV is the norm for FHA purchase deals).

After loss of income, the #1 reason why homeowners walk away from their mortgage and let the property go to foreclosure is when it’s upside-down, underwater, or the mortgage debt is higher than the current market value.

The #1 cause of financial insolvency or bankruptcy is related to unpaid medical bills; Americans have never been unhealthier than today, tragically.

Published inflation rates have varied between 6% and 9% in recent months. Yet, the true inflation numbers are closer to 15% to 17% if the federal government used the same data analysis techniques as a few decades ago.

Subprime automobile loans recently surpassed 6%, which is the highest default number ever.

Energy Price Swings

Back in April 2020, oil prices per barrel briefly went negative to reach -37 per oil barrel. As a result, the cost of the barrel itself was more valuable than the oil inside. Energy costs are usually a root cause of both inflation and deflation as we’ve all seen over the past few years. Some oil barrel prices later surpassed $100 in 2022 as many of us saw $5, $6, $7, $8, and $9 per gallon, especially here in California.

Derivatives

At the peak of the last housing bubble burst in 2007 and 2008, the estimated value of the global derivatives marketplace was about $1,500 trillion. Today, the global derivatives market is closer to $3,000 trillion and may reach closer to $4,000 trillion by 2027 if the same annual growth rates continue, as per Globe Newswire. The frozen global derivatives market was the main cause of the Credit Crisis or Great Recession back in 2008.

A derivative is a hybrid financial and insurance instrument that can be leveraged up to 50 times. Or, it’s a glorified bet on the future direction of things like interest rate directional trends as seen with interest rate option derivatives. Even though us mortgage brokers and real estate investors were blamed by the media for the Credit Crisis, defaulted subprime mortgage debt represented less than 1% of all debt that imploded back then.

Denial or Research – Pick Your Poison or Solution

What we avoid in life controls us. It’s usually best to research as many different positive, neutral, or negative sides to any story or asset class like real estate. You’re more likely to survive any economic downturn if you make precautionary plans and keep your eyes wide open for new opportunities that few others around you can see at the time.

Denial is usually the most common first reaction when presented with dissenting opinions or scary topics, especially if you work or invest in the real estate or financial sectors. Yet, you must thoroughly analyze all sides, question everything (especially your own perspectives), and focus on the potential opportunities or solutions.

The harder we fall, the higher we bounce back, hopefully. If the Federal Reserve does a massive pivot and starts cutting rates again and increasing their Quantitative Easing strategies with more asset purchases (stocks, bonds, and mortgages) to boost the economy again, the market may do another positive market swing skyward. Only time will tell, so get your popcorn ready!


Rick Tobin

Rick Tobin has worked in the real estate, financial, investment, and writing fields for the past 30+ years. He’s held eight (8) different real estate, securities, and mortgage brokerage licenses to date and is a graduate of the University of Southern California. He provides creative residential and commercial mortgage solutions for clients across the nation. He’s also written college textbooks and real estate licensing courses in most states for the two largest real estate publishers in the nation; the oldest real estate school in California; and the first online real estate school in California. Please visit his website at Realloans.com for financing options and his new investment group at So-Cal Real Estate Investors for more details. 


Learn live and in real-time with Realty411. Be sure to register for our next virtual and in-person events. For all the details, please visit Realty411.com or our Eventbrite landing page, CLICK HERE.

Distressed Properties & Contradictory Data

By Rick Tobin

The published economic numbers that we see daily or weekly don’t necessarily reflect the reality of what’s going on with the job market, financial markets, and housing sector, especially. Reality can be a bitter pill to swallow, figuratively. Is our economy still booming, starting to soften or flatten, or is it turning negative?

The mainstream media likes to share economic data that’s published by the federal government which seems completely disconnected from reality. While we see articles published weekly about massive layouts from well-known companies like Amazon, Walmart, Disney, PayPal, Zoom, Dell, IBM, Microsoft, Google, Salesforce, Vimeo, Coinbase, and Goldman Sachs, we also see published unemployment data that’s claimed to be near historical lows. These massive layoffs and “near historical low unemployment” numbers seem to be contradictory to one another as they can’t both be true at the same time.


ADVERTISEMENT


What about housing? In early 2023, we are still seeing all-time record highs for median rents and median home prices in most regions of the country. Yet, we’ve also seen mortgage rates increase by two or three times above peak lows as last seen in late 2021 and the 1st quarter of 2022.

Generally, the booming or busting housing markets are tied directly to mortgage rate trends and whether or not loan underwriting is easing or tightening. How can property values still be peaking while we’ve also possibly seen the fastest increase with short-term and long-term rates in US history at the exact same time? This is another fine example of a contradictory marketplace with two extreme opposites at the same time.

Bubble Burst and Suppressed Housing Supply

For many of us, the absolute worst housing market bubble burst that we experienced firsthand was back in 2008. In California and many other states, the housing market started to peak in late 2006 or 2007. The catalyst for this peaking housing market bubble burst was directly related to the Federal Reserve’s aggressive rate hike campaign over the period of 24 months between June 2004 and June 2006. The Fed raised rates a total of 4.25% from 1% to 5.25% with 17 separate rate hikes.

Because so many borrowers were in adjustable rate mortgages or home equity lines of credit, the mortgage payments began to double or triple for property owners after these 17 rate hikes. As a result, the number of distressed or foreclosure properties reached several million with a high percentage located in California and other Sun Belt states like Nevada, Arizona, and Florida.

Let’s take a look at the worst bubble burst year ever in US history to better understand how bad the price collapse was in 2008:

● Home prices fell in 35 states.
● California had the biggest price collapse at -29.6%.
● Nevada had the 2nd biggest price drop at -22.8%.
● Arizona fell -19%, Florida dropped -18.2%, and Rhode Island fell -13.7%.


ADVERTISEMENT


Even worse, California home prices fell a total of -42% off their previous bubble peak. Nevada’s median price dropped -39% from their peak. Both Arizona and Florida fell -33% from their respective previous market peaks.

Because the number of distressed properties increased so dramatically, a very high number of lenders did not start the foreclosure process even if the borrowers were several years behind on their mortgage payments. If a lender or mortgage loan servicer did initiate the foreclosure and take it all the way to the final auction sale, millions of these properties were not placed up for sale as they became a massive shadow inventory of unoccupied homes.

Many lenders did not want to acknowledge or share how bad their non-performing loan portfolio was at the time with their stockholders, equity partners, or derivatives investors. If the lenders did foreclosure on every delinquent mortgage in their portfolio, it might financially crush the same lender. As a result, it wasn’t unheard of to read about homeowners in Beverly Hills mansions with $5 million loans who hadn’t made one mortgage payment in three years or longer.

The same thing is happening today here in 2023. Lenders aren’t starting the foreclosure process as often as they’re legally entitled to due to borrowers not making payments for months or years. It’s also been claimed by many people that the current number of millions of empty shadow inventory homes that are not currently listed for sale may exceed the total number of all homeless people nationwide. Whether this claim is accurate or not as it would be incredibly challenging to prove, our current listing home supply nationwide is still near historical lows.

For those people who claim that the housing market is busting, home prices nationwide increased by +10.1% year-over-year through October 2022 in spite of mortgage rates doubling or tripling in less than a year, according to CoreLogic. This home price “slowdown” is still almost two or three times higher than historical annual price gains.

Record High Consumer Debt & Rents

Total credit card debt reached a new record high of $930.6 billion in the fourth quarter of 2022, according to data released by TransUnion. At the same time, credit card rates and fees reached all-time record highs with average annual rates exceeded 20% for many consumers.

Consumer credit spending fell by a whopping 65% from November ($33.1 billion) to December 2022 ($11.56 billion) in spite of it being the traditionally peak holiday spending month. This is a potential major warning sign that a high percentage of consumers are tapped out and/or their credit card lenders are starting to drastically reduce the borrowers’ ceiling limit.

Several published economic surveys discovered that most of the polled consumers did not have $500 as cash available to cover any unexpected financial emergencies like with medical bills, rising utilities, or skyrocketing grocery costs. One of the most important pieces of information about the health of the economy is directly related to the typical consumers’ cash reserves. When access to cash is near historical lows and rents and mortgage payments are at historical highs, then something has to give at some point.

How can people qualify and afford these astronomical rents for just a 1-bedroom apartment that are listed below? Please keep in mind that many landlords want to see their tenant applicants have gross monthly income that is at least three times the proposed rent. For places like New York City, this would be equal to $11,370 in gross income to qualify for a typical one bedroom apartment that’s leasing for a median of $3,790 per month.

Top 5 Most Expensive Rent Cities (1-Bedroom Apartment)

1. New York, NY: $3,790
2. Boston, MA: $3,000
3. San Francisco, CA: $3,000
4. Miami, FL: $2,660
5. San Jose, CA: $2,540
Source: Boardroom

In many regions, the monthly rents are higher than the median mortgage payments. This trend is unlikely to continue onward as mortgage rates rise and rents start to flatten or fall.

Rising Rates and Distressed Properties

In some metropolitan regions like Los Angeles, they’ve had two and three year long moratoriums that protect tenants from paying their rents due to the Covid issue. Most landlords are small “Mom and Pop” type landlords who may be fortunate to own just one or two rentals. If their tenants haven’t paid rent in two or three years, then the property owner may default on their own mortgage and lose it to foreclosure, sadly.

Lenders and loan service companies will likely start to accelerate their foreclosure filings later this year. If so, this can be traumatizing for the distressed homeowners who may soon lose all of their equity and their roof over their head. At the same time, it can be an investment opportunity for others who keep their eyes open for bargain deals.

As of February 10, 2023, the Fed Funds Rate is at 4.58%. Some financial analysts think that the Fed may take their core rate up to 6% or higher later this year and keep it there for a relatively long period of time. If so, how will existing homeowners and buyer prospects be able to afford higher payments?

Many savvy real estate investors and licensees are now starting to describe early 2023 as a bit reminiscent of 2008. Yet, many others will say that the “the relatively low available supply home listing inventory” will protect us from any sort of a double-digit price collapse. While this may be very true and the Fed may be forced to suddenly start cutting rates in the near future if the economy really weakens, what happens if the shadow inventory is slowly released to the general public and the tenant and foreclosure moratoriums are lifted?

With any perceived positive, neutral, or negative situation, it’s usually very wise to focus on potential solutions for as many possible housing trends that may or may not happen in the near future. Few of us like to actually address possible negative situations as we remain stuck in the state of denial and cognitive dissonance where two contradictory situations must both be right at the exact same time even though they can’t both be true. What we avoid in life controls us, so we must face our fears head on and stay focused on the opportunities or solutions.


Rick Tobin

Rick Tobin has worked in the real estate, financial, investment, and writing fields for the past 30+ years. He’s held eight (8) different real estate, securities, and mortgage brokerage licenses to date and is a graduate of the University of Southern California. He provides creative residential and commercial mortgage solutions for clients across the nation. He’s also written college textbooks and real estate licensing courses in most states for the two largest real estate publishers in the nation; the oldest real estate school in California; and the first online real estate school in California. Please visit his website at Realloans.com for financing options and his new investment group at So-Cal Real Estate Investors for more details. 


Learn live and in real-time with Realty411. Be sure to register for our next virtual and in-person events. For all the details, please visit Realty411.com or our Eventbrite landing page, CLICK HERE.

Positive and Negative Housing Trends for 2023

By Rick Tobin

Pending home sales in November 2022 tumbled down by 4% month-over-month and collapsed by -38.6% year-over-year, the largest annual drop ever recorded. Pending home sales are often looked to as a leading indicator of existing home sales due to the fact that they are properties which go under contract a month or two before the sales contract closes or is completed.

Home sales fell 7.7% on a monthly basis in November 2022 as per the National Association of Realtors.This was the 10th consecutive month of home sales declines. The seasonally adjusted annualized pace was 4.09 million housing units. However, the median national sales price increased 3.5% to $370,700 from the year prior partly due to a low housing supply.

The good news for the real estate data for November 2022 is that the $370,000 median national home price was the highest November price that Realtors have ever recorded. It was also the 129th consecutive month (or almost 11 years) of year-over-year price gains that continue to be an all-time record dating back to the tracking of these numbers starting in 1968.

An estimated 23% of all homes sold in November were above the list price due to the tight housing supply. By the end of November, there were 1.14 million homes for sale, which was reported as a still-low 3.3 month supply. These unsold months’ supply of home listing numbers were still well below historical average selling times that can still reach at least six months with moderate price gains.

US annual home price gains, based on S&P Global’s Case-Shiller data, were reported as having year-over-year home price appreciation of +10.4% year-over-year in October 2022 prior to falling to +8.64% year-over-year price gains one month later in November 2022. By comparison, the year-over-year price gains in July and August 2022 were +15.6 and +13%, respectively, as price gains continue to decelerate. This +8.64% annual home price growth rate is still much better than the historical average near 3% to 5% year-over-year gains over the past 50 years.


ADVERTISEMENT


The number of new listings in November fell 28.4% year-over-year, which was the biggest drop on record aside from April 2022 near the start of the global pandemic designation. Ironically, the overall supply of homes for sale rose by 4.6% at the same time due to average home listings taking longer to sell. For example, the typical listed home took 37 days to go under purchase contract as compared with 23 days a year prior.

Approximately 78% of recent buyers financed their home purchase in 2022, which was down from 87% in 2021. This was driven by the increased share of repeat buyers who paid all cash that came from the significant equity gains from their previous residence. The typical down payment for first-time buyers was 6% and 17% for repeat buyers as per the NATIONAL ASSOCIATION OF REALTORS®.

Construction, Rate Hikes, & Institutional Investors

Homebuilder sentiment dropped for the 12th consecutive month in December 2022 to the lowest level since 2012, according to the National Association of Home Builders. The builder sentiment score for newly built single-family homes dropped 2 points to 31 on the National Association of Home Builders/Wells Fargo Housing Market Index. Anything below a 50 score is considered negative for builder sentiment.

By comparison, the same builder sentiment index one year prior in December 2021 had an 84 rating which was incredibly positive. Regionally, the building sentiment was the most positive in the Northeast and most negative out West where home prices are well above the national average.

Earlier in 2022, the Federal Reserve’s FOMC (Federal Open Market Committee) began their aggressive rate hike campaign which pushed mortgage rates skyward. In most of the first quarter of 2022, the Fed was still holding the federal funds rate near zero until increasing rates on these FOMC meeting dates the rest of the year:

FOMC Meeting Date

December 14, 2022

November 2, 2022  

September 21, 2022

July 27, 2022         

June 16, 2022

May 5, 2022

March 17, 2022

Rate Change (bps)

+50

+75

+75

+75

+75

+50   

+25

Federal Funds Rate

4.25% to 4.50%

3.75% to 4.00%

3.00% to 3.25%

2.25% to 2.5%

1.5% to 1.75%

0.75% to 1.00%

0.25% to 0.50%

With mortgage rates rising, the number of all-cash buyers for residential properties also increased. An estimated 31.9% of home purchases in the U.S. were paid for with all cash in October. This was a jump from 29.9% one year earlier and the highest percentage of cash buyers since 2014.


ADVERTISEMENT


A study conducted by Zelman & Associates found that institutional investors found on Wall Street and elsewhere have set aside upwards of $110 billion to purchase single-family homes in 2023. If so, this is equivalent to the purchase of an additional 400,000 homes.

By the end of 2022, institutional investors like BlackRock, Blackstone, Vanguard, State Street, and others owned 700,000 homes, which represents approximately 3% of the nation’s 20 million single-family homes as per Roofstock. An additional 400,000 new home purchases in 2023 may take the institutional investor ownership of homes up to 1,100,000 or 5.5% of the nation’s total home supply. However, MetLife Investment Management predicts that institutional investors may own as much as 40% of the nation’s single-family home supply by 2030.

Inflation – A Double-Edged Sword

Home construction costs jumped by more than 30% between just the start and end of 2022. Approximately 62% of homebuilders are now offering financial incentives to buyers to boost their home sales by offering seller credits towards mortgage rate buy-downs, paying points and other closing costs for buyers, and reducing home prices. The average home price reduction for new homes in December 2022 was 8%, which was up from 5% and 6% price cuts earlier in the year.

Many food prices have risen at an even larger percentage increase rate than home construction costs. For example, vegetable prices increased by 80% year-over-year by November 2022. Quite surprisingly, vegetable prices absolutely skyrocketed by 38% in just one month between October 2022 to November 2022, as per the U.S. Bureau of Labor Statistics. Yet, these price jumps for veggies were tame by comparison when reviewing egg price changes which rose by a whopping 244% year-over-year increase by November 2022.

A case study conducted by Research Affiliates that’s entitled History Lessons: How “Transitory is Inflation” found that it can take more than 10 years for higher annual inflation periods of more than 8% to later fall back down to 3% or below. After reviewing data from 14 developed nations during the January 1970 to September 2022 time range, they found that nations which reached 8% published inflation rates like seen in the US and most of Europe later kept increasing to 10% inflation rates or higher over 70% of the time.

The published US inflation rates surpassed 6% in 2021 and 8% in 2022. However, the true inflation numbers are probably much higher. Regardless, the Research Affiliates group reported that it generally takes nations with 8% inflation rates or higher a median time of nine to 12 years for inflation to later fall below 3%. In recent times, the Federal Reserve has clearly stated that their goal is to bring published inflation rates down closer to 2% to 3% partly by way of their aggressive rate hike strategies. Based upon historical trends, we may not reach 3% or lower published inflation rates until well after 2030.

The main cause of our record inflation rates today and the declining purchasing power of our dollar is directly caused by the Federal Reserve and US Treasury creating too many dollars within a relatively short period of time. For example, the M1 money supply (cash and cash-like instruments) rose from $4 trillion in March 2020 to $20 trillion in October 2021. The more dollars created, the lower the purchasing power of the same dollars as clearly seen by how empty our grocery carts look after spending $100.

As the purchasing power of the dollar falls and prices for consumer goods, services, and asset prices rise, 63% of Americans are living paycheck-to-paycheck according to a survey conducted by LendingClub. This is why it’s so important to invest in assets that generate consistent monthly income for you like with real estate.

Historically, real estate has proven to be an exceptional hedge against inflation. Generally, home prices rise at or above the annual published inflation rates. As such, few investments in the future may benefit as much as real estate as the dollar continues to weaken and true inflation rates continue onward in the double-digit rate range.

Price Cuts, Buying Opportunities

During significant economic downturns like during The Great Depression (1929 – 1939); The Early 1980s Recession (1980 – 1982) when interest rates hit all-time record highs (21.5% for the Prime Rate in December 1980 and an 18.6% peak high for the 30-year fixed rate mortgage in October 1981) to combat the then record inflation levels, which we actually surpassed here in 2022); The Savings and Loan Bust (late 1980s through mid-1990s); and the ongoing Credit Crisis or Global Financial Crisis that officially started during the summer of 2007 and reached market depths for real estate prices between late 2008 and 2013 especially, the savvy, educated, and fearless investors picked up real estate assets for as little as cents on the dollar while creating generational wealth for their families.

The Global Financial Crisis hasn’t actually ended in spite of many years of Quantitative Easing (QE) that began in November 2008 (QE: Federal Reserve creates money out of thin air to purchase stocks, bonds, and mortgages while boosting asset prices and reducing deflationary risks) and Operation Twist (Federal Reserve simultaneously buys and sells long-term and short-term bonds to artificially suppress mortgage rates down towards historical lows) which helped push real estate prices skyward to all-time record highs just as mortgage rates hit all-time record lows.

While many home prices continue flattening or falling as mortgage rates rise, it’s important to remember these wise words about how new opportunities arise during almost any boom or bust time period:

“To get rich, you have to be making money while you’re asleep.”
“Creative financing creates more opportunities for you.”
“Cash is king.”


Rick Tobin

Rick Tobin has worked in the real estate, financial, investment, and writing fields for the past 30+ years. He’s held eight (8) different real estate, securities, and mortgage brokerage licenses to date and is a graduate of the University of Southern California. He provides creative residential and commercial mortgage solutions for clients across the nation. He’s also written college textbooks and real estate licensing courses in most states for the two largest real estate publishers in the nation; the oldest real estate school in California; and the first online real estate school in California. Please visit his website at Realloans.com for financing options and his new investment group at So-Cal Real Estate Investors for more details. 


Learn live and in real-time with Realty411. Be sure to register for our next virtual and in-person events. For all the details, please visit Realty411.com or our Eventbrite landing page, CLICK HERE.

Underwater Homes and Short Sale Solutions

By Rick Tobin

Many homebuyers who purchased their homes near the peak of the latest 7-year “boom” or positive valuation cycle earlier in 2022 now may have zero or negative equity. This is partly due to the fact that so many owner-occupied home buyers came in with very low to no down payments anywhere between 0% (VA loans) to 3% (Conforming) or 3.5% (FHA). It may cost the average seller 6% to 8% in real estate commission fees, title, escrow, and transfer taxes to sell their homes which actually makes the number of underwater (mortgage debt exceeds current market value) properties higher than what’s reported.

Black Knight’s October 2022 Mortgage Monitor report shared details about how 8% of homes purchased in 2022 were already underwater and that almost 40% of properties had less than 10% equity left in their homes. The hardest hit property owners were first-time home buyers with small down payments such as seen with FHA, Conforming, and VA. Should home values fall 5% to 20%+ next year, then the number of underwater properties will rise like the tides during a peak moon cycle.


ADVERTISEMENT


According to Black Knight, more than 20% of the 2022 FHA/VA purchases had negative equity as of October 2022 and a whopping 66% had less than a 10% equity stake. Black Knight also reported that excluding the time near the start of the pandemic the “early-payment default” (EPD) rate, which tracks mortgage delinquencies within the first six months of origination, hit the highest level since 2009. 

The good news is that there’s still some high percentages of equity for homes purchased prior to 2022 due to how fast those homes appreciated nationwide over the past 10+ years. For example, the negative equity rates for all properties nationwide still remains historically low near 0.84% as of the third quarter of 2022. These very low negative equity numbers may change and rapidly increase in 2023 if mortgage rates keep rising and home values flatten or decline.

The #1 reason after the loss of income for why a homeowner is likely to walk away from their home and mortgage payment obligations is when their property is upside-down or underwater with negative equity. While the homeowner may be drowning in debt with a financial anchor that takes their home equity is underwater and figuratively sinking as well. 

Maritime Admiralty Law and Money Terms

You are primarily made up of water. In fact, upwards of 70% of your body and 80% of your brain is derived from water. Iodine is the body’s natural disinfectant, so effectively you’re made up of saltwater somewhat like found in one of the Seven Seas (Atlantic, Pacific, Arctic, and Indian Oceans, the Mediterranean Sea, the Caribbean, and the Gulf of Mexico). If you’re fortunate enough to live near the sea, you probably own a much more valuable home due to the higher demand for coastal properties.

Did you know that the early origins of US law and taxation authority come from Old English Common Law and Maritime Admiralty Law? Common Law is determined by past judicial or courtroom decisions or verdicts in civil and criminal courthouses.

Maritime Admiralty Law is also referred to as the Law of the Sea. It’s a body of private international law that governs relationships between private parties or business entities which also operate ships or vessels. The law of water dominates the entire planet partly since about 71% of the Earth’s surface is covered in water.

Let’s take a look next at how money, real estate, water, and taxation share many hidden and not-so-hidden meanings or double meanings:

Merchant banker: Merchant banks were the first modern banks which evolved from medieval merchants that traded in various commodities such as cloth merchants. These merchant bankers also helped finance the sales of these goods. “Mer” is also defined as sea as seen with the word Mermaid (woman of the sea).

Flipper: The name of a beloved dolphin in a television show from the 1960s because the dolphin completed amazing flips in the air. A home flipper, on the other hand, is an investor who purchases distressed and discounted fixer-upper properties prior to remodeling and later selling or “flipping” them. A flipper who sells his rental property in less than a year will probably pay much higher tax penalties for his or her short-term gains.

Whale: A very wealthy client or organization with lots of money.

Loan Shark: A third-party lender who typically offers very expensive loans for fairly short periods of time over weeks, months, or a few years to motivated clients who may be short of funds.

Cash flow: Real estate investors strive to find assets that create positive and consistent cash flow or income streams just like they may see at their nearby river where they may fish. For real estate investors who are fortunate enough to have a positive monthly cash flow while letting their money work hard for them instead of vice versa, they will have more time to fish or go boating.

Sink: A poorly managed rental property or significant debt can sink you financially and pull you to the bottom like a falling anchor.

Float: When you’re running out of cash, a bank loan can float you like a lifebuoy so that you keep your head above the water and don’t figuratively “drown” in debt.

Liquid: A person with lots of access to money or capital is described as being liquid or having exceptional liquidity. Conversely, a person with no money is illiquid.

(River)bank: A courtroom judge rules from the bench. In Latin, bench translates as bank. Most courtroom disputes are monetary disputes, so the judge acts somewhat like a merchant banker while trying to balance out the assets and liabilities. Banks also are located on both sides of a river or riverbank.

Docs: Boat or larger ships are tied to docks when not at sea. Clients sign loan docs or documents when purchasing a property with a mortgage.

Current-sea: All nations have their own acceptable currency like the dollar. Seawater also flows via an ever-changing current.

Underwater: A property that has more mortgage debt than the current market value.

Soak: You may be familiar with the “Let’s soak the rich” phrase when some people are demanding that wealthier Americans pay their “fair share” of taxes.

Levy: For taxation purposes, a levy is the government’s right to seize your property if you don’t pay your taxes. For water purposes, a levee protects dry land from water damage that may originate from a nearby river or flood channel.

Sinking Prices and Short Sales

“I can’t change the direction of the wind, but I can adjust my sails to always reach my destination.” – Jimmy Dean

If you think a financial storm is coming on the horizon, you can either do nothing as the figurative waves crash over the front of your boat’s bow until it sinks or you can adjust your sails and head off towards safety, sunshine, and new prosperity. Today, you’re more likely than not to read negative news about real estate and the financial markets as we’re near the low point or trough of the economic wave or cycle.

Kieran Clancy, a senior economist at Pantheon Macroeconomics, published a recent analysis about how he thought that home values may fall 20% from their June 2022 peak wave highs. New home listings fell 19% from the 2017-2019 levels, which was the largest deficit in six years aside from the early pandemic and lockdown months in 2020.

Home delistings reached an all-time record high by November 2022 as more sellers got frustrated with fewer buyer prospects who also weren’t offering high enough purchase price offers for many of the sellers. A record 2% of homes for sale across the nation were delisted as being offered for sale every single week on average for 12 consecutive weeks through November 20 as per Redfin.


ADVERTISEMENT

An underwater and a potential short sale deal is a home sales situation where the mortgage debt exceeds the current market value at the time of the sale. The seller and advising real estate and mortgage licensees can assist with persuading the existing lender or mortgage loan servicer to significantly discount their debt concurrently at the payoff of the short sale. This way, the seller doesn’t lose more money, the buyer pays fair market value, and both the listing and buyer’s agents receive their commissions.

Some of our past clients who came to us for financing have worked on several thousand short sale deals, so our team is very experienced with offering solutions for all parties involved. For motivated sellers, you should set realistic home listing prices in the near term to maximize your profits or to minimize your losses. For real estate licensees, you should learn more about how short sales and creative seller-financed sales can help you and clients at a much faster pace while increasing gains or reducing losses at the same time.

What goes up must come down, but it also can build up powerful future momentum like a peaking wave crest as we “surf” or “sail through” the continuous boom and bust wave cycles!!!


Rick Tobin

Rick Tobin has a diversified background in both the real estate and securities fields for the past 30+ years. He has held seven (7) different real estate and securities brokerage licenses to date, and is a graduate of the University of Southern California. Rick has an extensive background in the financing of residential and commercial properties around the U.S with debt, equity, and mezzanine money. His funding sources have included banks, life insurance companies, REITs (Real Estate Investment Trusts), equity funds, and foreign money sources. You can visit Rick Tobin at RealLoans.com for more details.


Learn live and in real-time with Realty411. Be sure to register for our next virtual and in-person events. For all the details, please visit Realty411.com or our Eventbrite landing page, CLICK HERE.

The Next 7-Year Housing Cycle

By Rick Tobin

I’ve shared written content in numerous articles, real estate courses, and in college textbooks over the past few decades about how we’re likely to see 7-year boom and bust cycles that especially affect real estate. Almost all boom and bust cycles for housing, stocks, bonds, and the rest of the financial markets are directly tied to the direction of short-term and long-term interest rates.

The Federal Reserve will first flood the markets with “easy money” prior to slamming the figurative brakes by tightening up access to the money supply partly by raising rates. Positive or booming housing market eras usually take place when interest rates were below historical averages and had more flexible mortgage underwriting allowances like experienced during the peak no income qualification and subprime credit mortgage years between the late 1990s and 2006.


ADVERTISEMENT


History tends to repeat itself partly since the Federal Reserve, US Treasury, and consumers generally follow the same strategies and steps. First, the Federal Reserve lowers rates to stimulate a sluggish economy which increases demand for housing assets while pushing inflation rates skyward right alongside increased government spending. Then, asset prices, consumer spending, government deficits, and money creation grow too quickly prior to the Fed raising short-term rates while making the housing market and overall economy cool down.

In many ways, the 7-year boom and bust cycle becomes more of a vicious cycle or downward cycle in that these financial actions can overinflate asset bubbles prior to them later popping. Energy price directions are generally a root cause of inflation. Housing prices, inflation, and oil costs are more likely to rise and fall together while the purchasing power of the dollar or petrodollar (“oil for dollars”) goes in the opposite direction in an inverse seesaw-like direction.

“The definition of insanity is doing the same thing over and over and expecting different results.” – Albert Einstein

7-Year Financial Cycle Examples

Let’s take a look at the last 7-year boom and bust cycles over the past 49 years to better understand how the current and future market directions can be more clearly seen or anticipated:

  • 1973 – Oil Shock Crash: This was directly related to the end of Bretton Woods when the “gold standard” was switched to the Petrodollar (“oil for dollars”) system beginning earlier in 1971. Between October 1973 and January 1974, oil prices quadrupled within just a few months due to the ongoing OPEC (Organization of Petroleum and Exporting Countries) Embargo, or the reduction in oil production, increasing U.S. demand, and skyrocketing oil prices for consumers.
  • 1980 – Record High Interest Rates: This is primarily because energy costs started to rise while the purchasing power of the dollar fell. As a result, the Federal Reserve began pushing rates skyward starting in 1978. For example, the Fed increased their Fed Funds Rate from 6.75% in January 1978 to 10.25% in April 1979 and later to 20% in December 1980. The US Prime Rate for the most creditworthy borrowers reached 21.5% in December 1980 and the 30-year fixed mortgage rate peaked at 18.6% in October 1981. Shortly thereafter, seller-financed home sales became more appealing because fewer buyers could qualify for these high double-digit mortgage rates just like they may in 2023 and beyond.

ADVERTISEMENT


  • 1987 – Black Monday Stock Market Crash: On October 19, 1987, the Dow Jones index fell by more than 22% in just one day, which is still an all-time record overall percentage loss. For better perspective, a 22%+ price drop for today’s 33,000+ Dow Jones index would equal more than a 7,000 point drop in one day. All of the 23 major world markets at the time experienced huge losses for the October 1987 time period. Eight of these markets declined by 20% to 29%; three fell by 30% to 39% (Malaysia, Mexico, and New Zealand); and three market regions dropped by over 40% (Australia, Hong Kong, and Singapore).
  • 1994 – US Bond Market Crash: In spite of low inflation rates at the time, the Fed thought it would be wise to increase rates from 6.2% in early 1994 up to 7.75% by mid-September. These quick rate hikes eliminated upwards of $600 billion of Treasury bond values in the US and caused international bond losses that were closer to $1.5 trillion.
  • 2001 – Stock Market Crash and 9/11: After the longest shutdown of the stock market since 1933 following the tragic 9/11/01 day, trading resumed on September 17th prior to the Dow tanking 684 points (a 7.1% decline). For this first week back in session, the Dow dropped a total of 1,370 points (or a 14% loss). The S & P 500 index fell 11.6% for the first week back after 9/11. Upwards of $1.4 trillion of stock value vanished for the first five days of trading after 9/11. Shortly thereafter, the Federal Reserve began a series of significant rate cuts which directly boosted stock and real estate values for many years up until the official start of the “Credit Crisis” in August 2007.
  • 2008 – Stock Market Crash: The Dow Jones fell an unlucky -777 points in one day on September 29, 2008, which was then an all-time record point loss. Quantitative Easing that began in November 2008, Operation Twist (Fed simultaneously bought and sold short-term and long-term bonds to drive overall rates downward), and other bailout strategies began shortly thereafter in order to attempt to boost stock and real estate values while artificially suppressing interest rates at later dates to near or at all-time low mortgage rates. The Dow Jones later reached a low of 6,547 on March 9, 2009 before Quantitative Easing kicked in and boosts a stock and real estate boom for many years.
  • 2015 – Currency Wars and Stock Market Pricing Glitches: The currency wars between the BRICS (Brazil, Russia, India, China, and South Africa) start to escalate in this same year with America’s Petrodollar (“oil for dollars”) currency system. As more nations start using BRICS financial instruments, many stock and bond trading platforms begin to experience significant disruptions in their asset prices. As a result, many large investors pull their funds out of stocks and bonds prior to later reinvesting the funds in residential and commercial real estate in the US partly for more pricing stability. Today, more nations are becoming BRICS members and leaving our Petrodollar system which may weaken the dollar further and push inflation rates higher.
  • 2022 – Record Inflation and Fastest Rate Hikes Ever: The published inflation rates, which are much lower than the actual inflation rates partly due to how the inflation measurement guidelines keep changing, reach all-time record highs that exceed the 1979 to 1981 era. The Fed’s rate hike pace in 2022 is potentially as much as the 2004-2006 rate hike era when the Fed increased rates 17 times from 1% to 5.25%. However, the Fed has a much more rapid pace to increase rates as much in just 12 months instead of 24 months between January 2022 and January 2023. The 30-year fixed mortgage rate increases from 3% or below to 6%, 7%, and 8%+ within this same calendar year and home prices start to flatten or decline.

Massive Oil Price Swings

Between mid-2014 and early 2016, the global economy faced one of the largest oil price declines in modern history. The 70% price drop during that period was one of the three biggest declines since World War II, and the longest lasting since the supply-driven collapse of 1986. There were seven previous 35% + oil price drops within the time span of between 12 and 18 months going as far back to 1986 up through 2008 which were as follows:

  • 1986 – “Oil Supply Shock” in Saudi Arabia
  • 1988 – Second stage of the 1980’s oil glut
  • 1991 – Gulf War end “Relief Rally”
  • 1993 – Weak worldwide demand and rising OPEC / North Sea production
  • 1998 – Price collapse related to the Asian markets bond and derivatives defaults
  • 2001 – High Tech, Telecommunication, and NASDAQ collapse and 9/11
  • 2008 – The Credit Crisis and the near implosion of world’s financial system

There were three additional 35%+ oil price swings within the same calendar year in 2020, 2021, and 2022 as the energy and financial markets got more volatile or unpredictable. In 2020 after the global coronavirus pandemic was declared on March 11, 2020, oil prices fell from a price peak near $70 per barrel to a negative price of -$37 per barrel. Back then, the price of the barrel was worth more than the oil inside for a short period of time. In 2021, oil prices swung from a high near $85 to a low closer to $47.

For the 2022 year, oil prices went skyward to over $122 per barrel for West Texas Intermediate (WTI) oil in March due to increasing global conflicts like seen with Russia and Ukraine and other factors. Later in the year as the economy started to weaken and demand for consumer goods, services, and assets like real estate started to fall, the WTI oil prices per barrel declined to $77 in early December.

Out of Chaos Comes Opportunity

Whether a market is busting or booming, you can create generational type wealth that can be passed on to your heirs if you’re ahead of your competition by keeping your eyes wide open. The old nursery school rhyme song that goes “the wheels on the bus go ‘round and ‘round, ‘round and ‘round, ‘round and ‘round” is something to keep in mind when watching either the start or end of a 7-year boom or bust cycle. Or, you should study the past to better understand the present and future potential financial trends.

Another warning sign to pay close attention to is the ongoing inverse yield curve situation where short-term bond yields are higher than long-term bond yields when they’re supposed to be the other way around. For example, the spread between a relatively short 2-year Treasury yield of 4.36% reached an all-time record spread difference of more than .82% higher than a 10-year Treasury yield which reached 3.54%. Historically, inverse yield curves are a signal that the financial markets are about to significantly weaken.

Whether the economy is becoming stronger or weaker, there’s opportunity for you as a buyer, seller, investment advisor, or as real estate licensee. For investors and first-time buyers, you might find a motivated seller who will sell their home at a discounted price and carry some equity as a new 1st, 2nd, or as a wraparound (land contract/contract for deed or all-inclusive trust deed or AITD). For real estate licensees, you might want to start learning more about how short sales work and how you can help bail out your clients with forbearance, loan modification, “subject-to mortgage” purchases, foreclosures, “cash for keys” deals, or bankruptcy situations.

Stay focused on your goals and targets in life rather than on any temporary obstacles. If and when the economy starts to really weaken and home prices flatten or fall, the Fed may then be inspired to start cutting rates as fast as possible prior to reigniting the next 7-year boom cycle.


Rick Tobin

Rick Tobin has a diversified background in both the real estate and securities fields for the past 30+ years. He has held seven (7) different real estate and securities brokerage licenses to date, and is a graduate of the University of Southern California. Rick has an extensive background in the financing of residential and commercial properties around the U.S with debt, equity, and mezzanine money. His funding sources have included banks, life insurance companies, REITs (Real Estate Investment Trusts), equity funds, and foreign money sources. You can visit Rick Tobin at RealLoans.com for more details.


Learn live and in real-time with Realty411. Be sure to register for our next virtual and in-person events. For all the details, please visit Realty411.com or our Eventbrite landing page, CLICK HERE.

Simplifying and Automating Commercial Mortgages

By Rick Tobin

Why can’t commercial lending be as flexible as residential lending? Residential mortgage lending for one-to-four unit properties has become more automated and streamlined for investors as we move forward here in the 21st century. More homeowners and investors are seeking out experienced independent mortgage brokers who may have relationships with numerous financial institutions, nonbank lenders, or private money sources. With a few clicks of a button, the mortgage professional can quickly find the best financial solutions available for their clients and get approvals within minutes, hours, or days.

Commercial property lending, on the other hand, still seems stuck in the 20th century for many commercial applicants. It can be perceived as a “good ol’ boy/girl network” in that the commercial loan applicant needs to have some sort of a long-established personal relationship with their local community banker dating back to high school, college, or as fellow members at the local golf club before their loan requests are approved. If so, will they be types of friendly handshake approvals or not-so-friendly “take it or leave it” approvals?


ADVERTISEMENT


If the commercial loan applicant is fortunate to find a banker who may consider their deal, this same banker may request that the borrower move their deposits from other financial institutions to their bank before considering the applicant’s loan request. Should the loan be rejected either quickly or months later after a rather brutal loan underwriting process that may include a footlong stack of paperwork, the disheartened customer may give up hope and not know where to turn for another lending option.

Today, non-owner occupied residential properties (one-to-four units) offered as short-term or long-term rentals, multifamily apartments (5+ units), mixed-use, office, industrial, retail, and special purpose (auto repair shops, etc.) can all be viewed as a “commercial loan” by certain nonbank lenders that don’t collect customer deposits like traditional banks. With lower loan-to-value (LTV) ranges for certain asset-based loan products, the risk of default is lower for the nonbank lenders.

Wealth Creation from Commercial Property Ownership

Let’s take a look at commercial property trends and how much wealth was created for those fortunate owners who learned that it’s much better to let their money work hard for them than vice versa:

  • The estimated total dollar value of commercial real estate was $20.7 trillion as of Q2 2021. (Nareit and CoStar)
  • By 2050, commercial building floor space is expected to reach 124.3 billion square feet, a 33% increase from 2020. (Center for Sustainable Systems, University of Michigan)
  • 72% of commercial buildings in the US are 10,000 square feet or smaller. (National Association of Realtors)
  • The typical length of a building lease in the US is three to 10 years. (DLA Piper)
  • Commercial property prices rose by 20% between May 2021 and May 2022. (Green Street)
  • An estimated one-third of industrial space in the US is more than 50 years old. (NMRK)
  • For every $1 billion of growth in the e-commerce sector, it requires an extra 1.2 million square feet of new warehouse space. (Prologis)
  • Self-storage commercial unit REITs produced a 70% market return in 2021 (REIT)
  • Approximately 69% of all commercial buyers in the US need financing to purchase properties. (National Association of Realtors)
  • Sales of multifamily apartment buildings increased by 22.4% year-on-year in 2022 (Colliers)
  • Prior to the March 2020 pandemic designation, the industrial real estate sector had grown for 40 consecutive quarters or over 10 years. (NMRK)
  • Industrial vacancy rates nationwide fell below 3.7% at the end of 2021. (Cushman & Wakefield)
  • The Inland Empire (Riverside and San Bernardino counties) in California averaged an incredibly low 1.2% vacancy rate for industrial space. (Commercial Edge)
  • California had 27 of the 50 highest office rental prices in 2021. (Commercial Search)
  • The average annual return for commercial real estate investors is approximately 9.5%. (Mashvisor)
  • For every retail unit that closes, five new stores open up. (NRF)

Technological Advances for Commercial Loans

What if the commercial lending process could be digitized, sped up, and completed on a secure online loan application with just one point of contact? Your odds of success for getting a commercial property loan approved for a multifamily apartment building, mini-storage site, or small retail center will be much higher if your financial contact person is very experienced with commercial lending and has access to numerous lenders.

Commercial loans are somewhat like giant jigsaw puzzles. While the applicant’s loan package may not fit the guidelines required at one, two, or 10 different lenders, there are other lenders that have more flexible guidelines which allow lower positive, break-even, or even negative DSCR (Debt Service Coverage Ratio) with or without income verification.

Properties with lower positive cash flow or even negative cash flow estimates will likely not qualify at a local community bank or credit union. Yet, they may qualify with other nonbank lenders that do allow break-even or negative cash flow. Some of our lending partners are asset-based lenders that don’t review the applicant’s tax returns as well as provide financing for property improvements. These types of incredibly flexible lending guidelines can make the commercial loan application process much easier for the borrower.


ADVERTISEMENT


An Imploding Financial System and Increasing Bank Restrictions

In 2008, the Credit Crisis (aka Financial Crisis, Subprime Mortgage Crisis, or Global Financial Crisis) default risks became more readily apparent as these prominent financial institutions or government entities collapsed and/or were bailed out:

  • Bear Stearns: The fifth largest investment firm in the world that was heavily invested in mortgage-backed securities, collateralized debt obligations (CDOs), and other complex securities or derivatives instruments.
  • Lehman Brothers: The biggest bankruptcy ever involving over $600 billion in assets.
  • Washington Mutual (WAMU): Largest bank implosion in US history with almost $328 billion in assets.
  • FDIC (Federal Deposit Insurance Corporation): They only held $40 billion in cash reserves at the time of WAMU’s collapse, so the government had to silently bail them out to prevent bank runs.
  • Countrywide Mortgage: Once America’s #1 residential mortgage lender that almost imploded prior to being bailed out by Bank of America.
  • American International Group (AIG): They were the world’s largest insurance company and were bailed out by the US government starting with $85 billion while growing to more than $182 billion several years later.
  • Merrill Lynch: The world’s largest stock brokerage firm at the time with $2.2 trillion under management and 15,000 brokers that was taken over by Bank of America.

A derivative is a complex hybrid financial and insurance instrument which “derives” value from underlying assets or benchmarks like interest rate direction trends. Some financial analysts have stated that the total value of all global derivatives may be somewhere within the $1,500 to $3,000 trillion dollar region. If so, these derivatives dwarf all combined global assets by a significant multitude.

Because so many banks, investment firms, and insurance companies are heavily invested in one another partly by way of derivatives, this was why the Federal Reserve, the Bank of England, and other central banks around the world had to step in and bail out these multi-billion or multi-trillion dollar financial or insurance entities, directly or indirectly through others like Bank of America. If not, the global financial system would have fallen like a dominoes chain reaction.

Later, the LIBOR (London Interbank Offered Rate) Scandal, which came to light publicly in 2012, gave us a glimpse of the sheer magnitude of the derivatives market. This financial scandal was about how certain financial institutions invested or bet on the future direction of interest rates tied to LIBOR (the benchmark interest rate at which major global banks lend to one another) while being claimed to be rigged or known ahead of time so that the derivatives bets had a better chance of success.

Several publications like Rolling Stones Magazine wrote articles about the LIBOR Scandal potentially being the largest financial scandal in world history that affected upwards of $500 to $700 trillion in global assets. The named financial institutions in various publications or lawsuits which were alleged to have benefited, directly or indirectly, in the LIBOR Scandal included Deutsche Bank, HSBC, Barclays, Citigroup, JP Morgan Chase, and the Royal Bank of Scotland.

What’s important to understand is that many of the best known banks in the world may only have a few trillion of depositor assets in their checking and savings accounts today. However, they may have exposure to upwards of $50 + trillion in derivatives. As a result of their financial exposure to derivatives, these banks may be unwilling or unable to make investment property loans to even their most creditworthy clients partly due to tighter lending restrictions that came from the passage of the Dodd-Frank Act back in 2010.

This is why mortgage brokers and their non-bank lending partners became the better funding solution for investors while “handshake deals” at local banks don’t matter as much because so many banks may be technically insolvent.

Ironically, it was claimed that delinquent subprime mortgages represented less than 1% of all financial losses related to the Credit Crisis or Financial Crisis. Rather, the complex derivatives investments that were leveraged 50+ times the original amount of investments such as interest-rate options were the root cause. Sadly, mortgage professionals and stated income subprime loans still continue to be primary scapegoats. As a result, fewer banks are willing to offer more flexible residential or commercial property loans that don’t verify income.

Value Analysis for Commercial Properties

How lenders analyze income and expenses for commercial properties can be quite complex and overwhelming. Properties that do not meet most or all of these stringent underwriting guidelines may be prime candidates for asset-based loans.

Let’s try to review and simplify some key valuation terms that lenders may consider before approving or denying a borrower’s request:

Loan-to-value (LTV): The proposed loan amount as a percentage of the estimated property value. Many lenders prefer a loan-to-value range somewhere within the 50% to 75% LTV range. For purchase deals, these same lenders prefer that their clients put upwards of 25% to 50% of the purchase price as a cash down payment, depending upon the creditworthiness of the borrower and the property type.

Net Operating Income (NOI): The NOI for a commercial property can be summed up as follows: Gross Income – Operating Expenses = NOI

The property’s operating expenses include insurance, property management, utilities, and other day-to-day costs related to maintaining the property. However, the mortgage payments are not included within the NOI calculation.

Cap or Capitalization Rate: It’s a mathematical formula used to calculate the real or projected future rate of return on a property based on the net operating income that the property generates. The lower the cap rate, the better the property. Higher cap rates, in turn, are viewed as riskier investments. Cap Rate = NOI / Current Market Value

Property values and cap rates are inverse to one another like a seesaw. Decreasing cap rates as seen with prime downtown properties that are fully occupied leads to increasing property values. Conversely, rising cap rates for older rundown commercial properties usually correspond with falling property values.

Value Estimate: The property’s value estimate can be determined by way of the following formula: NOI / Cap Rate

For example, let’s look at two multifamily apartment buildings located in different cities with the exact same NOI but cap rates that are not nearly the same:

Building 1: $160,000 NOI divided by an 8% cap rate ($160,000 / .08%) = $2,000,000 value

Building 2: $160,000 NOI divided by a 4.5% cap rate ($160,000 / .045%) = $3,555,556 value

Generally, multifamily apartment rates have the lowest cap rates for income-producing properties that aren’t considered to be residential (one-to-four unit) properties. As per an analysis for the 2nd quarter of 2022 by Real Capital Analytics and the NAR, here are their numbers:

Property Type
Apartments
Industrial
Office
Retail

Cap Rate
4.5%
5.7%
6.3%
6.3%

DSCR: The easiest way to remember the debt service coverage ratio (DSCR) is that it’s used to determine whether or not a property has positive (1.25x), neutral or break-even (1.0x), or negative cash flow (0.75x). The DSCR is the ratio of operating income that’s available on a monthly or annual basis to service or cover the monthly mortgage payment (principal, interest, property taxes, insurance, etc.). As a mathematical formula, the DSCR can be visualized as follows: NOI / Debt Service

A small retail center that generates $10,000 per month in operating income and has a projected $8,000 per month in total mortgage payments would be calculated at 1.25x DSCR because the monthly or annual cash flow is 25% higher than the debt service ($10,000 / $8,000 = 1.25x). The net difference between $10,000 inflow and $8,000 debt service outflow is $2,000. This can also be calculated as $2,000 divided by the $8,000 in debt service ($2,000 / $8,000) which equals 25% more net cash flow to arrive at 1.25x DSCR.

Debt Yield: The commercial property’s NOI as a percentage of their total loan amount. The mathematical formula is as follows: NOI / Loan Amount = Debt Yield

For example, a small industrial building owner collects $100,000 NOI each year. His existing mortgage loan balance is $1 million, so his annual debt yield is 10% ($100,000 NOI / $1 million mortgage balance).

Multiple Underwriting Approval Solutions

As you better learn how lenders analyze properties, you will clearly understand that you have more than one loan program available. Some properties and owners will easily qualify after sharing tax returns, liquid assets, profit-and-loss statements, and a detailed income and expense history for their property. Other investors, however, know that their property’s cash flow is break-even or negative, but the future upside for these properties can be tremendous after occupancy rates are pushed higher.

Many commercial property owners experienced unusually high vacancy rates in recent years due to the combination of the pandemic, skyrocketing inflation, rising tenant payment delinquencies, and increasing rates for consumer debt. If so, the income and expense numbers for these commercial properties will probably not qualify at a traditional bank.

Commercial borrowers are more likely to qualify with asset-based nonbank lenders that may not closely review the income and expense numbers for the property. The verifying of income for asset-based, nonbank lenders isn’t necessary because these loans are based more on the appraised value of the subject property and its future income potential. At a later date when the income and occupancy rates are higher while the operating expenses decline, the owner can refinance into a much longer loan term at a lower rate and monthly payment.

Remember, it’s much better to have multiple lending options available for your property purchases or ballooning loan or cash-out refinance needs than just one local bank. The more efficient and flexible the mortgage broker’s technological systems and nonbank lending sources, the more likely you will close your loan and create significant income and increased wealth.


Rick Tobin

Rick Tobin has a diversified background in both the real estate and securities fields for the past 30+ years. He has held seven (7) different real estate and securities brokerage licenses to date, and is a graduate of the University of Southern California. Rick has an extensive background in the financing of residential and commercial properties around the U.S with debt, equity, and mezzanine money. His funding sources have included banks, life insurance companies, REITs (Real Estate Investment Trusts), equity funds, and foreign money sources. You can visit Rick Tobin at RealLoans.com for more details.


Learn live and in real-time with Realty411. Be sure to register for our next virtual and in-person events. For all the details, please visit Realty411.com or our Eventbrite landing page, CLICK HERE.