Weather Extremes, Homes, and Insurance Risks
By Rick Tobin
We live in interesting times these days with the unusual combination of all-time record highs for weather extremes, home prices, mortgage and overall consumer debt, and insurance costs.
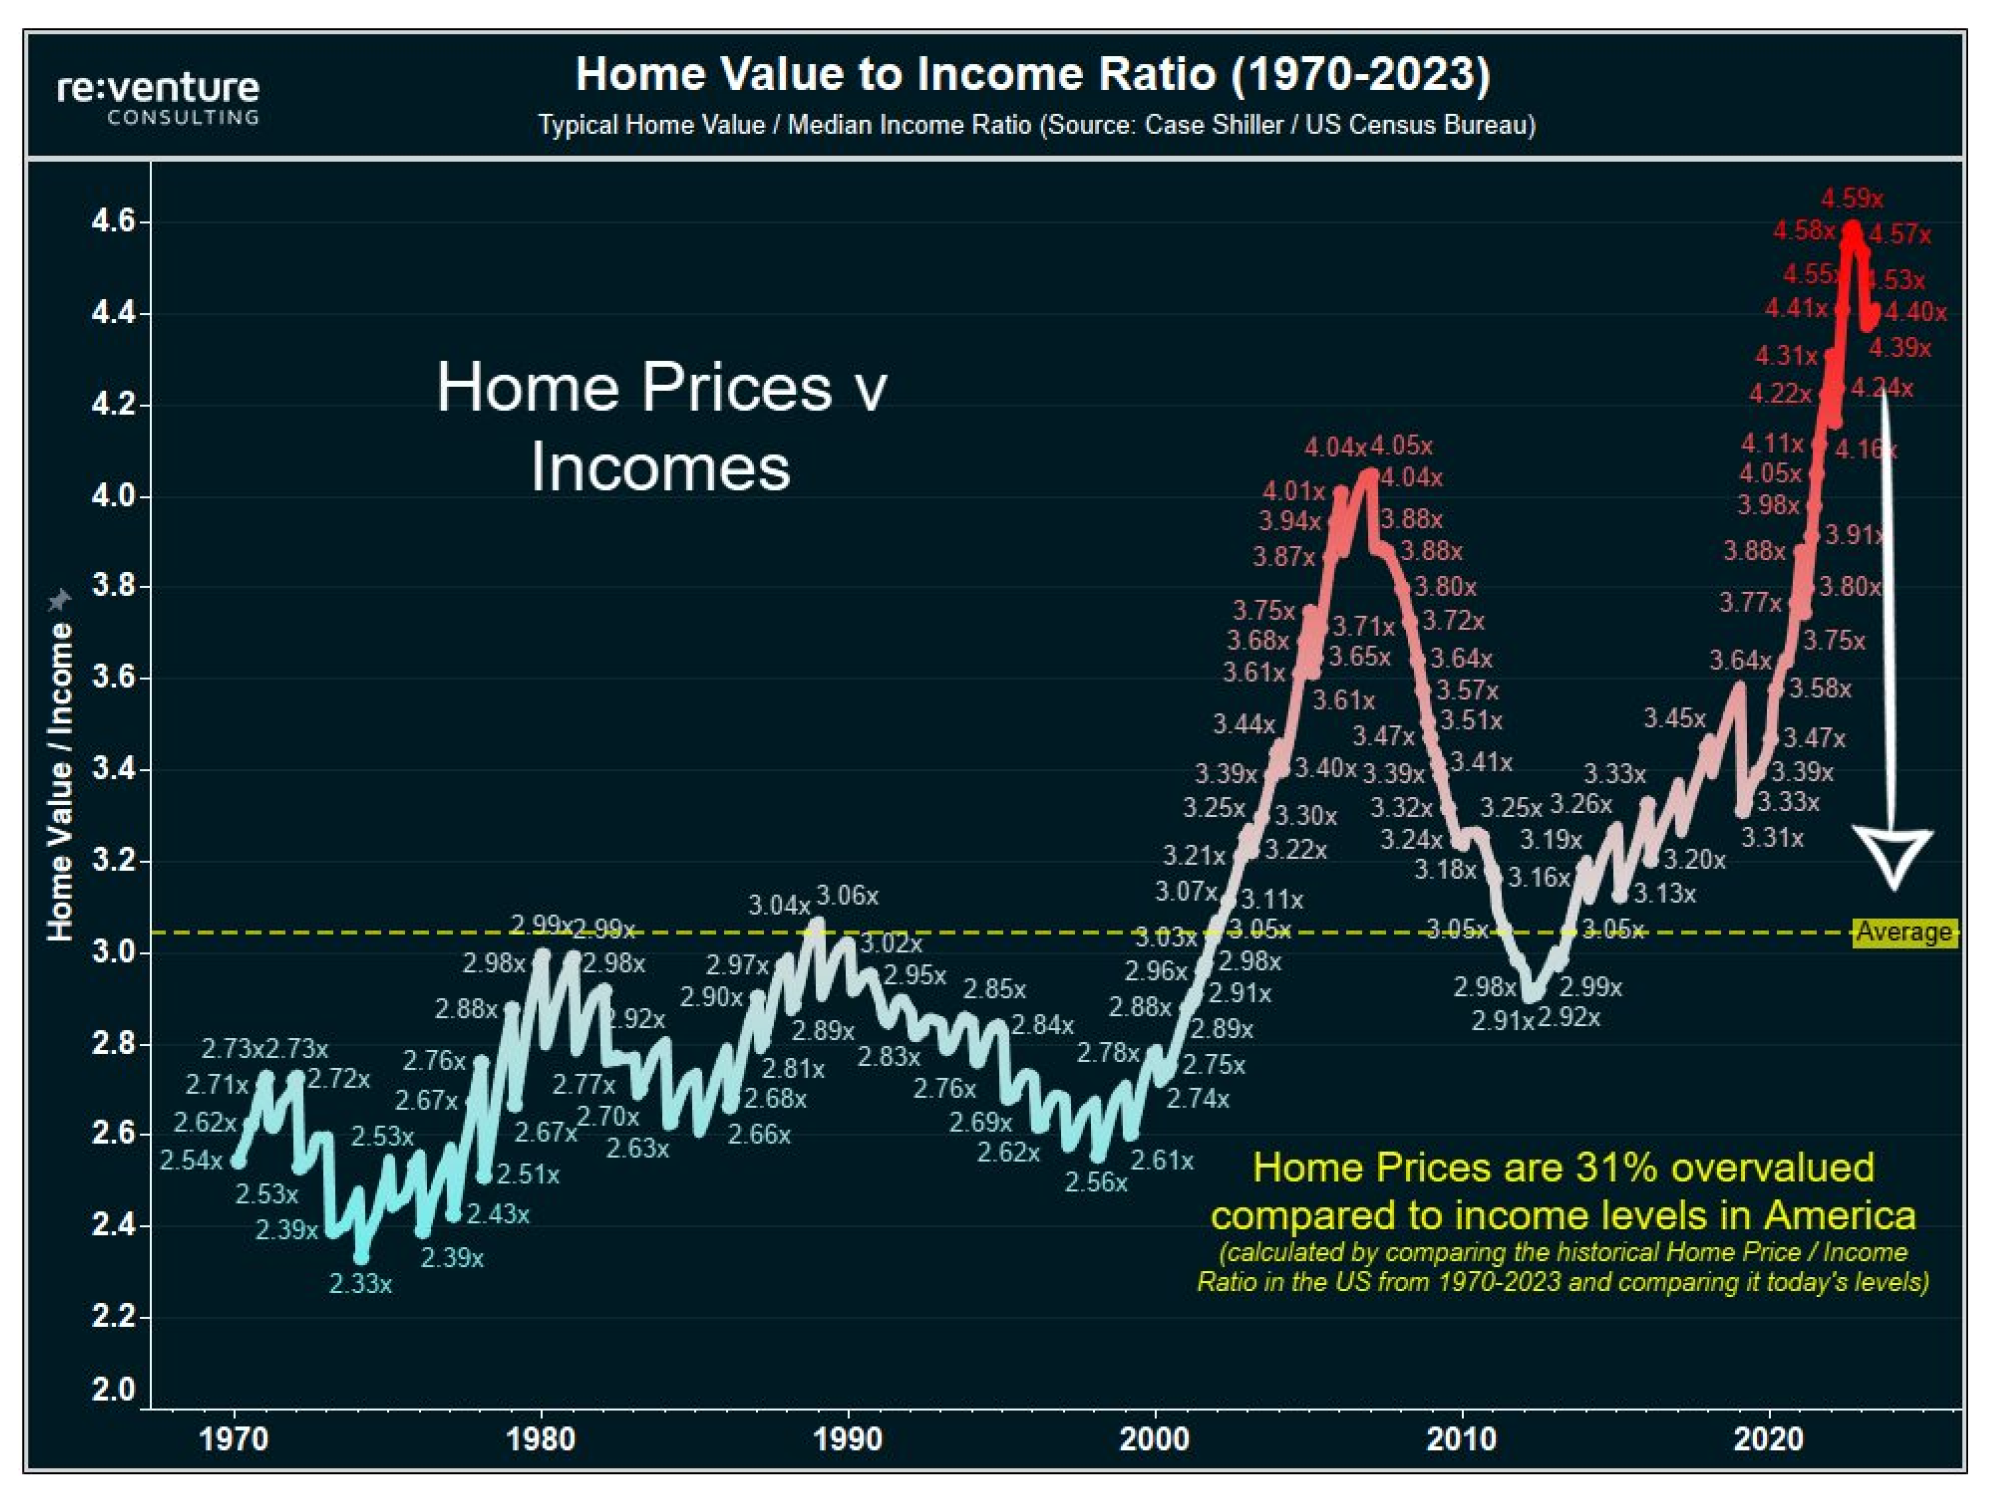
Redfin reports that the combined total U.S. home value rose $3.1 trillion in value between August 2023 and August 2024. If these home appreciation trends continue onward at a similar pace, the US housing market may soon surpass $50 trillion in total value by sometime next year in 2025.
If you have a mortgage secured by your home, you are required to carry some form of basic homeowners insurance that’s sufficient enough to cover your ownership risks as well as your mortgage lender’s risks.
article continues after advertisement

Water is usually the #1 source of damage to homes across the nation each year. These horrific hurricanes, tornadoes, and massive fires across the nation are financially wiping out many homeowners, insurance companies, and government agencies.
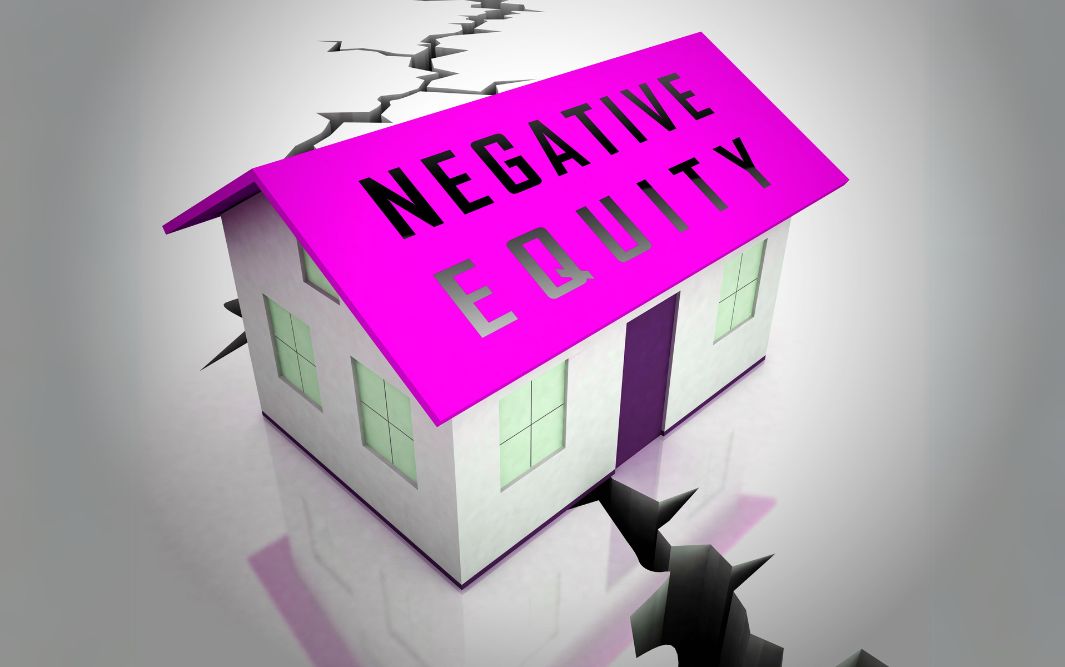
These literally underwater homes from the horrific floods in many Southeastern regions are also causing many of these properties to lose value and become “underwater” figuratively where the mortgage debt far exceeds the current market value.
The Pool of Disaster-Relief Funds Dried Up

Let’s take a closer look at some of the news headlines shared this year about how financially insolvent insurance or government agencies are these days:
FEMA (Federal Emergency Management Agency) has been technically insolvent or broke since earlier this year, as per FEMA themselves. The National Flood Insurance Program (NFIP) was described as being more than $20 billion in debt back in January 2024 at a panel hearing held by the U.S. Senate Banking, Housing and Urban Affairs Committee.
“The Small Business Administration’s (SBA) disaster assistance loan program is out of money after hurricanes Helene and Milton struck parts of the United States, the agency has announced.”
– ZeroHedge
The Citizens Property Insurance Corporation is described as the “last” option for insurance within the state of Florida. However, Citizens was also described by many as being out of money before Hurricanes Helene and Milton reached the Florida shores.

“Citizens was created by the Florida Legislature in August 2002 as a not-for-profit, tax-exempt, government entity to provide property insurance to eligible Florida property owners unable to find insurance coverage in the private market.”
– Citizens Property Insurance Corporation
Hurricane Helene and Milton might’ve caused more than $200 billion dollars’ worth of damage in Florida, North Carolina, and other nearby regions, according to The Real Deal.
Who will bail out FEMA first so that FEMA can bail out the National Flood Insurance Program, Citizens, SBA, and others?
Top 10 Largest Insurance Payouts

Will Hurricane Helene and/or Hurricane Milton break the all-time financial damage record set by Hurricane Katrina or at least reach the all-time Top 3? Please see the Top 10 financial damage list that I put together before in past articles and real estate courses.
Hurricane Ian, which hit Florida and other regions in late September 2022, has already caused more than $109 billion in overall damage claims in Florida alone. How will the insurance industry make it through another hurricane and fire season in Florida, California, Oregon, Washington, Idaho, Texas, Louisiana, and elsewhere?
Floods from horrific rain storms or hurricanes especially are generally the most common and costly natural disasters each year. Within the past 20 years, the 10 most financially damaging floods in the history of the National Flood Insurance Program (NFIP) happened while exceeding $50 billion dollars in costs. A whopping 75% of national flood insurance payouts have happened since 2002.
article continues after advertisement

The 10 largest payouts in the history of the National Flood Insurance Program on an adjusted inflation basis up through the second quarter of 2022 were as follows:
1. Hurricane Katrina – $22.17 billion
2. Superstorm Sandy – $10.05 billion
3. Hurricane Harvey – $$10.03 billion
4. Hurricane Ike – $3.32 billion
5. Louisiana severe storms and flooding (2016) – $2.83 billion
6. Hurricane Ivan – $2.40 billion
7. Hurricane Jeanne – $2.15 billion
8. Hurricane Ida – $1.64 billion
9. Hurricane Irene – $1.58 billion
10. Hurricane Irma – $1.26 billion
Source: FEMA
Upwards of 75% of flood insurance funds that were paid by the National Flood Insurance Program (NFIP) to property residents were located in just five states: Louisiana, Texas, Florida, New York, and New Jersey. After inflation adjustments, Louisiana was the highest-ranked state with NFIP payouts at $28.9 billion since 1978. The highest percentage of NFIP payouts to Louisiana residents were as a result of Hurricane Katrina. which totaled more than $22.1 billion dollars.
Paying High Premiums with Lower Chances of Coverage Benefits

It’s not uncommon for Florida residents to pay close to an average near $1,000 per month for homeowners insurance coverage. I’ve heard of property owners in the high-risk Florida Keys region who pay upwards of $100,000 per year for insurance coverage for homes valued near $2 million dollars.
It’s one thing to pay significant amounts for home insurance coverage protection benefits when you may later need it if a storm or fire damages your home. Yet, it’s even worse when the insurance carrier later denies any coverage protection.
For example, the lesser known Hurricane Debby that reached Florida as a Category 1 storm on August 5, 2024 caused significant damage to homeowners and businesses.
According to published data released by the Florida Office of Insurance Regulation, nearly 60% of all Hurricane Debby insurance claims cases were listed as “closed” just about one month after the storm hit. More than half of those insurance claim cases were listed as “closed without payment.”
As of September 6, 2024, the Florida Office of Insurance Regulation data showed that 19,973 insurance claims were filed after Hurricane Debby. The number of closed claims were listed as 11,090. Of these closed claims, 6,447 were listed as closed without any payments and 58% of those claims were completely denied, according to ABC Action News.
High-Rise Condominium Tower Risks

The implosion of the Champlain Towers in Surfside, Florida (Miami-Dade) back in 2021 was a catalyst to set off a chain reaction that is adversely affecting high-rise towers in Florida and even across the nation to this day.
As a result, a higher percentage of all-cash buyers who can self-insure like BlackRock, Vanguard (BlackRock’s largest shareholder), Blackstone (BlackRock spinoff), and others will likely acquire a higher percentage of these properties in the near future. Gee, what’s the common link here?
The legal outcome of the Champlain Towers collapse story was the SB 4-D legislation, which passed in 2022, that requires all owners of condominiums older than 30 years to hire outside engineering and/or architects to thoroughly inspect these properties no later than December 31, 2024.
These inspections will also be used to ensure that the usually financially insolvent HOAs have enough funds to cover the repairs or they must rapidly increase the monthly HOA payments that could be increased by several hundred or thousands of dollars per month.

Local, state, or federal agencies may have the power or legal right to fine or assess apartment building landlords or individual high-rise condominium owners with $100,000 to $300,000+ retrofit requirements per unit to modernize balconies, air conditioning and heating systems, appliances, windows, and other property features while insurance costs skyrocket.
Then, these older and more spacious affordable building units may be replaced with new smaller and more costly “smart” buildings that rent for $10 to $20+ per square foot (or up to $4,000/month for a 200 square foot unit) while closely following the newly restrictive high-density zoning laws.
If so, there will be an increasing number of motivated sellers who wish to avoid these new HOA assessments and “green living” requirements, especially if their own homeowners insurance company cancels their policies due to the perceived risks.
A homeowner with a mortgage who loses all access to insurance will then later have a mortgage default trigger and subsequent foreclosure filing, sadly.
Check Your Insurance Policies

No matter where you live, there are potential internal and external risks that can severely damage your home or rental property investments. Please call your insurance agent to discuss the best ways to minimize your risks and maximize your asset protection.
You may also consider speaking with local experienced home inspectors who can advise you how to best clear trees and shrubs near your home to reduce fire risks and how to protect against floods and mold risk.
For most Americans, the bulk of their net worth comes from the equity in their primary home. To best protect your wealth and to keep a roof over your head, please surround yourself with a knowledgeable team of inspectors and insurance, mortgage, and real estate agents who can help advise and protect you at the same time.

Rick Tobin
Rick Tobin has worked in the real estate, financial, investment, and writing fields for the past 30+ years. He’s held eight (8) different real estate, securities, and mortgage brokerage licenses to date and is a graduate of the University of Southern California. He provides creative residential and commercial mortgage solutions for clients across the nation. He’s also written college textbooks and real estate licensing courses in most states for the two largest real estate publishers in the nation; the oldest real estate school in California; and the first online real estate school in California. Please visit his website at Realloans.com for financing options and his new investment group at So-Cal Real Estate Investors for more details.
Learn live and in real-time with Realty411. Be sure to register for our next virtual and in-person events. For all the details, please visit Realty411.com or our Eventbrite landing page, CLICK HERE.