
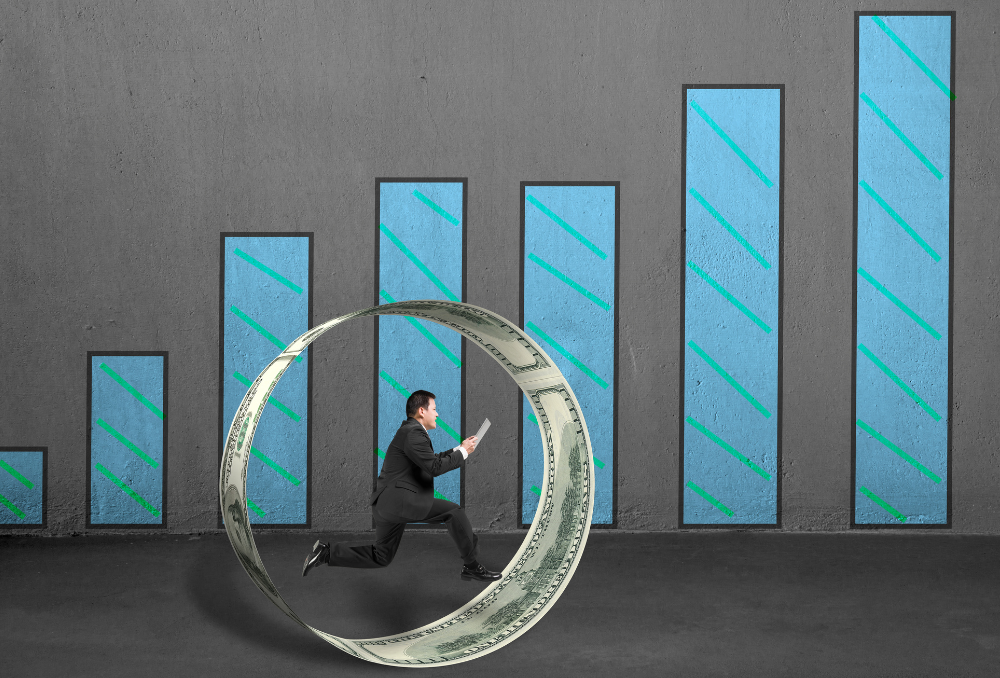
The Next 7-Year Housing Cycle
|
Getting your Trinity Audio player ready...
|
By Rick Tobin
I’ve shared written content in numerous articles, real estate courses, and in college textbooks over the past few decades about how we’re likely to see 7-year boom and bust cycles that especially affect real estate. Almost all boom and bust cycles for housing, stocks, bonds, and the rest of the financial markets are directly tied to the direction of short-term and long-term interest rates.
The Federal Reserve will first flood the markets with “easy money” prior to slamming the figurative brakes by tightening up access to the money supply partly by raising rates. Positive or booming housing market eras usually take place when interest rates were below historical averages and had more flexible mortgage underwriting allowances like experienced during the peak no income qualification and subprime credit mortgage years between the late 1990s and 2006.
ADVERTISEMENT

History tends to repeat itself partly since the Federal Reserve, US Treasury, and consumers generally follow the same strategies and steps. First, the Federal Reserve lowers rates to stimulate a sluggish economy which increases demand for housing assets while pushing inflation rates skyward right alongside increased government spending. Then, asset prices, consumer spending, government deficits, and money creation grow too quickly prior to the Fed raising short-term rates while making the housing market and overall economy cool down.
In many ways, the 7-year boom and bust cycle becomes more of a vicious cycle or downward cycle in that these financial actions can overinflate asset bubbles prior to them later popping. Energy price directions are generally a root cause of inflation. Housing prices, inflation, and oil costs are more likely to rise and fall together while the purchasing power of the dollar or petrodollar (“oil for dollars”) goes in the opposite direction in an inverse seesaw-like direction.
“The definition of insanity is doing the same thing over and over and expecting different results.” – Albert Einstein
7-Year Financial Cycle Examples
Let’s take a look at the last 7-year boom and bust cycles over the past 49 years to better understand how the current and future market directions can be more clearly seen or anticipated:
- 1973 – Oil Shock Crash: This was directly related to the end of Bretton Woods when the “gold standard” was switched to the Petrodollar (“oil for dollars”) system beginning earlier in 1971. Between October 1973 and January 1974, oil prices quadrupled within just a few months due to the ongoing OPEC (Organization of Petroleum and Exporting Countries) Embargo, or the reduction in oil production, increasing U.S. demand, and skyrocketing oil prices for consumers.
- 1980 – Record High Interest Rates: This is primarily because energy costs started to rise while the purchasing power of the dollar fell. As a result, the Federal Reserve began pushing rates skyward starting in 1978. For example, the Fed increased their Fed Funds Rate from 6.75% in January 1978 to 10.25% in April 1979 and later to 20% in December 1980. The US Prime Rate for the most creditworthy borrowers reached 21.5% in December 1980 and the 30-year fixed mortgage rate peaked at 18.6% in October 1981. Shortly thereafter, seller-financed home sales became more appealing because fewer buyers could qualify for these high double-digit mortgage rates just like they may in 2023 and beyond.
ADVERTISEMENT
- 1987 – Black Monday Stock Market Crash: On October 19, 1987, the Dow Jones index fell by more than 22% in just one day, which is still an all-time record overall percentage loss. For better perspective, a 22%+ price drop for today’s 33,000+ Dow Jones index would equal more than a 7,000 point drop in one day. All of the 23 major world markets at the time experienced huge losses for the October 1987 time period. Eight of these markets declined by 20% to 29%; three fell by 30% to 39% (Malaysia, Mexico, and New Zealand); and three market regions dropped by over 40% (Australia, Hong Kong, and Singapore).
- 1994 – US Bond Market Crash: In spite of low inflation rates at the time, the Fed thought it would be wise to increase rates from 6.2% in early 1994 up to 7.75% by mid-September. These quick rate hikes eliminated upwards of $600 billion of Treasury bond values in the US and caused international bond losses that were closer to $1.5 trillion.
- 2001 – Stock Market Crash and 9/11: After the longest shutdown of the stock market since 1933 following the tragic 9/11/01 day, trading resumed on September 17th prior to the Dow tanking 684 points (a 7.1% decline). For this first week back in session, the Dow dropped a total of 1,370 points (or a 14% loss). The S & P 500 index fell 11.6% for the first week back after 9/11. Upwards of $1.4 trillion of stock value vanished for the first five days of trading after 9/11. Shortly thereafter, the Federal Reserve began a series of significant rate cuts which directly boosted stock and real estate values for many years up until the official start of the “Credit Crisis” in August 2007.
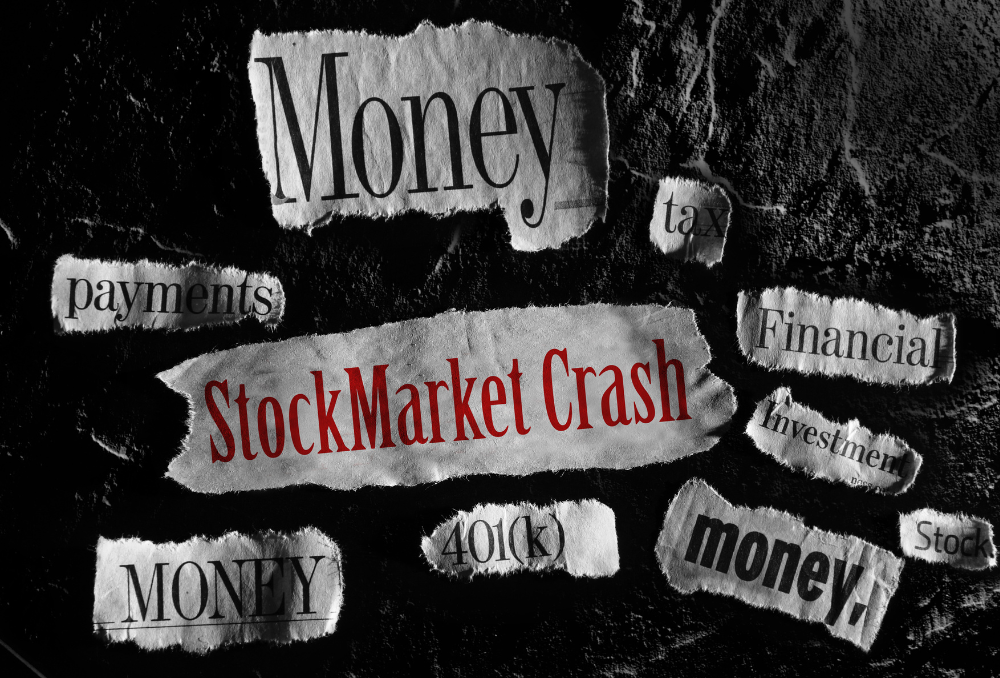
- 2008 – Stock Market Crash: The Dow Jones fell an unlucky -777 points in one day on September 29, 2008, which was then an all-time record point loss. Quantitative Easing that began in November 2008, Operation Twist (Fed simultaneously bought and sold short-term and long-term bonds to drive overall rates downward), and other bailout strategies began shortly thereafter in order to attempt to boost stock and real estate values while artificially suppressing interest rates at later dates to near or at all-time low mortgage rates. The Dow Jones later reached a low of 6,547 on March 9, 2009 before Quantitative Easing kicked in and boosts a stock and real estate boom for many years.
- 2015 – Currency Wars and Stock Market Pricing Glitches: The currency wars between the BRICS (Brazil, Russia, India, China, and South Africa) start to escalate in this same year with America’s Petrodollar (“oil for dollars”) currency system. As more nations start using BRICS financial instruments, many stock and bond trading platforms begin to experience significant disruptions in their asset prices. As a result, many large investors pull their funds out of stocks and bonds prior to later reinvesting the funds in residential and commercial real estate in the US partly for more pricing stability. Today, more nations are becoming BRICS members and leaving our Petrodollar system which may weaken the dollar further and push inflation rates higher.
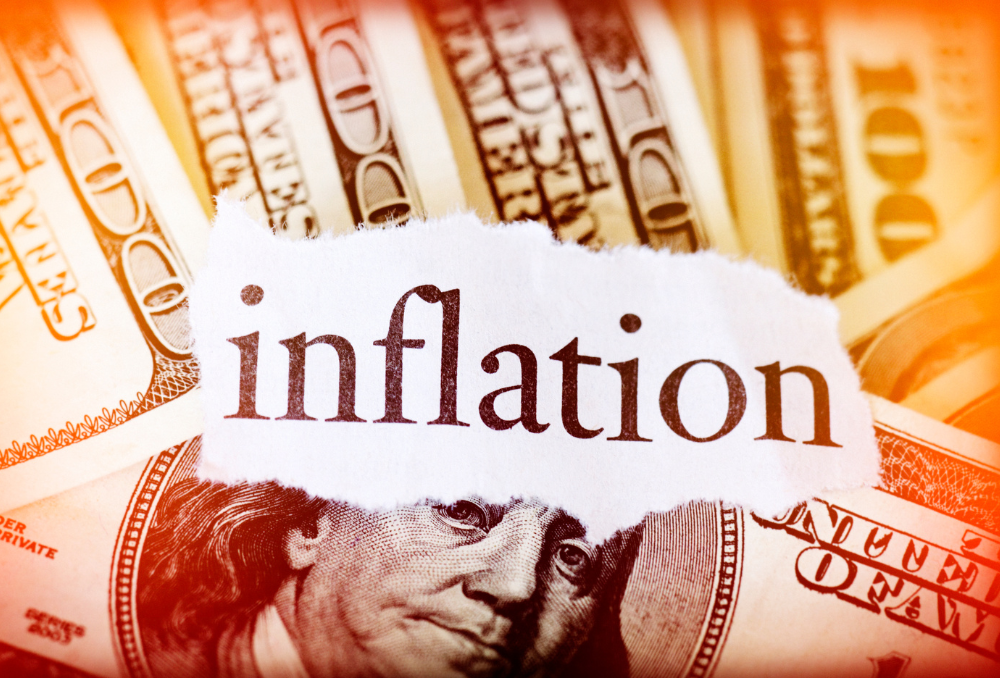
- 2022 – Record Inflation and Fastest Rate Hikes Ever: The published inflation rates, which are much lower than the actual inflation rates partly due to how the inflation measurement guidelines keep changing, reach all-time record highs that exceed the 1979 to 1981 era. The Fed’s rate hike pace in 2022 is potentially as much as the 2004-2006 rate hike era when the Fed increased rates 17 times from 1% to 5.25%. However, the Fed has a much more rapid pace to increase rates as much in just 12 months instead of 24 months between January 2022 and January 2023. The 30-year fixed mortgage rate increases from 3% or below to 6%, 7%, and 8%+ within this same calendar year and home prices start to flatten or decline.
Massive Oil Price Swings
Between mid-2014 and early 2016, the global economy faced one of the largest oil price declines in modern history. The 70% price drop during that period was one of the three biggest declines since World War II, and the longest lasting since the supply-driven collapse of 1986. There were seven previous 35% + oil price drops within the time span of between 12 and 18 months going as far back to 1986 up through 2008 which were as follows:
- 1986 – “Oil Supply Shock” in Saudi Arabia
- 1988 – Second stage of the 1980’s oil glut
- 1991 – Gulf War end “Relief Rally”
- 1993 – Weak worldwide demand and rising OPEC / North Sea production
- 1998 – Price collapse related to the Asian markets bond and derivatives defaults
- 2001 – High Tech, Telecommunication, and NASDAQ collapse and 9/11
- 2008 – The Credit Crisis and the near implosion of world’s financial system

There were three additional 35%+ oil price swings within the same calendar year in 2020, 2021, and 2022 as the energy and financial markets got more volatile or unpredictable. In 2020 after the global coronavirus pandemic was declared on March 11, 2020, oil prices fell from a price peak near $70 per barrel to a negative price of -$37 per barrel. Back then, the price of the barrel was worth more than the oil inside for a short period of time. In 2021, oil prices swung from a high near $85 to a low closer to $47.
For the 2022 year, oil prices went skyward to over $122 per barrel for West Texas Intermediate (WTI) oil in March due to increasing global conflicts like seen with Russia and Ukraine and other factors. Later in the year as the economy started to weaken and demand for consumer goods, services, and assets like real estate started to fall, the WTI oil prices per barrel declined to $77 in early December.
Out of Chaos Comes Opportunity
Whether a market is busting or booming, you can create generational type wealth that can be passed on to your heirs if you’re ahead of your competition by keeping your eyes wide open. The old nursery school rhyme song that goes “the wheels on the bus go ‘round and ‘round, ‘round and ‘round, ‘round and ‘round” is something to keep in mind when watching either the start or end of a 7-year boom or bust cycle. Or, you should study the past to better understand the present and future potential financial trends.

Another warning sign to pay close attention to is the ongoing inverse yield curve situation where short-term bond yields are higher than long-term bond yields when they’re supposed to be the other way around. For example, the spread between a relatively short 2-year Treasury yield of 4.36% reached an all-time record spread difference of more than .82% higher than a 10-year Treasury yield which reached 3.54%. Historically, inverse yield curves are a signal that the financial markets are about to significantly weaken.
Whether the economy is becoming stronger or weaker, there’s opportunity for you as a buyer, seller, investment advisor, or as real estate licensee. For investors and first-time buyers, you might find a motivated seller who will sell their home at a discounted price and carry some equity as a new 1st, 2nd, or as a wraparound (land contract/contract for deed or all-inclusive trust deed or AITD). For real estate licensees, you might want to start learning more about how short sales work and how you can help bail out your clients with forbearance, loan modification, “subject-to mortgage” purchases, foreclosures, “cash for keys” deals, or bankruptcy situations.
Stay focused on your goals and targets in life rather than on any temporary obstacles. If and when the economy starts to really weaken and home prices flatten or fall, the Fed may then be inspired to start cutting rates as fast as possible prior to reigniting the next 7-year boom cycle.

Rick Tobin
Rick Tobin has a diversified background in both the real estate and securities fields for the past 30+ years. He has held seven (7) different real estate and securities brokerage licenses to date, and is a graduate of the University of Southern California. Rick has an extensive background in the financing of residential and commercial properties around the U.S with debt, equity, and mezzanine money. His funding sources have included banks, life insurance companies, REITs (Real Estate Investment Trusts), equity funds, and foreign money sources. You can visit Rick Tobin at RealLoans.com for more details.
Learn live and in real-time with Realty411. Be sure to register for our next virtual and in-person events. For all the details, please visit Realty411.com or our Eventbrite landing page, CLICK HERE.