
Posts

Limited Home Inventories & Soaring Prices

By Rick Tobin

Nationwide during the first quarter of 2021, homeowners with mortgages saw their home equity jump by a staggering 20% as compared to one year earlier. The dollar amount gains for the first quarter (January 1st – March 31st) alone for homeowners across the nation amounted to a whopping $2 trillion in total homeowner value gains, according to CoreLogic.

The average US homeowner gained $26,300 in additional home equity over the past year. According to Experian and CNBC, the average Generation X consumer had $32,878 in non-mortgage related debt such as credit cards, student loans, and car loans. When equity growth exceeds debt in just a few months or within one year, this is usually a positive for homeowners.
In California, the average homeowner gained $11,000 per month in equity during the first quarter of 2021 ($33,000 in three months) as the average statewide home appreciated 39% in just 12 months ending in May 2021 to reach $818,000 per California home. In April 2021, the top three metropolitan regions for year-over-year home price gains were Phoenix, San Diego, and Seattle. The median sales price for the Southern California region in the same April month reportedly appreciated at a pace of $1 every two minutes, according to DQ News/CoreLogic. Each day has 1,440 minutes (24 hours x 60 minutes), so this would be equivalent to a price gain of $720 per day and approximately $21,600 per month over 30 days.

Declining Home Listings and Rising Demand

graph down up

Image from Pixabay

Values for products or services usually fluctuate up or down based upon supply and demand. When demand is strong and home listing supplies are low, then home prices rise. Let’s take a look next at some of the primary factors for these suppressed listing supplies and why there’s so much demand in spite of an ongoing pandemic designation: 1. Near record low mortgage rates: Most buyers need mortgages from third-party lenders or mortgage brokers. The lower the interest rate, the more affordable that the monthly mortgage payment is for the borrower. Many younger Generation Z or Millennial buyers or tenants have seen incredibly low mortgage rates for the past 10 years, so they may not remember that mortgage rates in the 2% to 3% rate ranges are shockingly low as compared with previous decades. To better understand how low mortgage rates have become in recent times, let’s review the average 30-year fixed mortgage rate by decade dating back to the 1980s: ● 12.7% in the 1980s ● 8.12% in the 1990s ● 6.29% in the 2000s ● 4.09% in the 2010s ● Near 3% in 2020 and the first half of 2021 2. The CARES Act and foreclosure and tenant eviction moratorium: The CARES (Coronavirus Aid, Relief, and Economic Security) Act was passed on March 27, 2020 by Congress as an attempt to minimize the economic hardship for homeowners and tenants nationwide. These moratoriums or legal postponements included within CARES prevented lenders from foreclosing on delinquent borrowers and stopped landlords from evicting tenants for missed rent payments. In addition, the CDC (Center for Disease Control) also issued their own guidelines which prevented landlords from evicting tenants or landlords would face both significant civil fines and criminal prosecution. As a result, the foreclosure inventory dried up as well because there were so few foreclosure auction sales or tenant evictions which would’ve allowed investors to sell their properties to new buyers and the overall supply of distressed homes for sale plummeted.
new-home-1664272_1280

Image from Pixabay

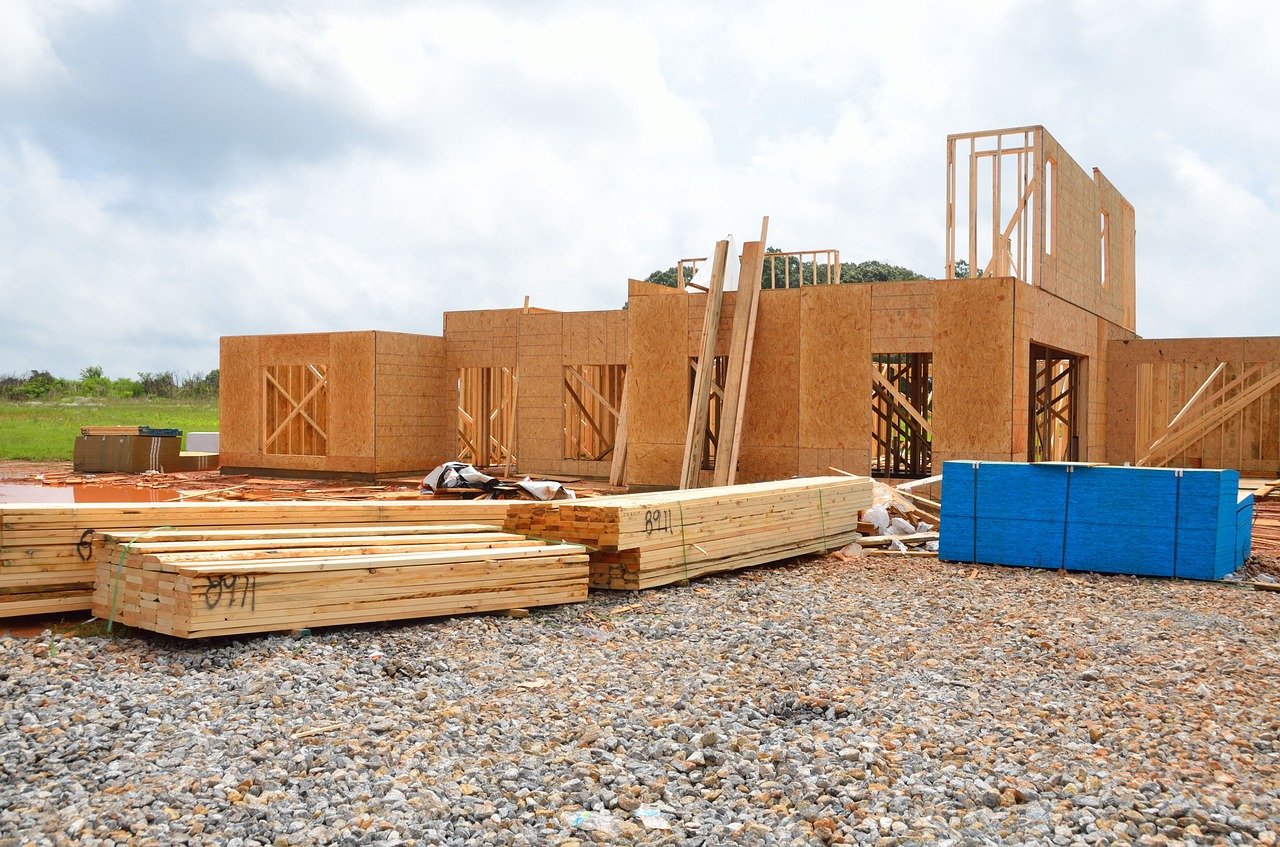
3. Declining home construction numbers: Freddie Mac, one of the largest national secondary market investors along with Fannie Mae, had claimed last year that there was a new home supply shortage of 2.5 million units as compared with the estimated buyer demand. Yet, the US hasn’t surpassed more than 1 million units, or 40% of this 2.5 million unit number, since 2007 when 1.046 million new single-family home units were built. During the depths of the Credit Crisis meltdown, new housing units declined to 430,600 in 2011. The Mortgage Bankers Association (MBA) did forecast that 2021 might finally break 1 million units again nationwide by reaching a projected 1.134 million unit number. California’s new housing start numbers, however, are not as positive as the rest of the nation. Back during the peak of the previous housing market boom in 2005, there were 150,000 new single-family home units built. In 2020, there were only 59,000 new single-family homes developed for a state with a population trending towards 40 million residents.
Some key factors why there are so few new homes being built in California are related to rising and unaffordable prices for land, lumber, steel, appliances, building permits, and environmental-impact or “sustainable living” fees. If a home builder can’t make a profit, they aren’t very likely to take a risk to develop a new housing community.

Multiple Bids and Quick Sales

As per the May 2021 Zillow Market Report, the average time that a listing took to sell, or days on market (DOM), was just six days in spite of home prices reaching all-time record highs in most US regions. The National Association of Realtors defines days on market (DOM) as the number of days the property is listed for sale on the local multiple listing service (MLS) up until the day that the buyer and seller have mutually agreed to the terms signed in the sales contract.
contract-4085336_1280

Image from Pixabay

Because it’s very likely that a listed home for sale will probably have multiple offers, sellers can pick and choose between the best offers that may include all cash offers, 7 to 14 day closings, waiver of all third-party reports such as appraisals and home inspections, and even the option for the seller to remain in the home for another 30 to 60 days rent-free so that the seller has enough time to find a new place.
Most buyers usually need a mortgage to purchase a property. In today’s hot housing market world, buyers and their advising buyer’s agents don’t have much time to get pre-approved from their local bank or mortgage broker. Some lenders may need a few days to a few weeks to formally pre-approve a borrower, depending upon how complete the original loan application package is at time of the loan submission.
Fewer sellers in multiple bid situations will even consider accepting a purchase offer from a buyer who is not formally qualified before the buyer writes up the offer. This is why it’s so important to get pre-approved first before going out with a knowledgeable real estate licensee who understands the local housing trends and searching for properties. If so, you’re much more likely to be successful as a buyer, seller, tenant, landlord, or advising real estate licensee.

Rick-Tobin-Professional-Pic-sharper

Rick Tobin

Rick Tobin has a diversified background in both the real estate and securities fields for the past 30+ years. He has held seven (7) different real estate and securities brokerage licenses to date, and is a graduate of the University of Southern California. Rick has an extensive background in the financing of residential and commercial properties around the U.S with debt, equity, and mezzanine money. His funding sources have included banks, life insurance companies, REITs (Real Estate Investment Trusts), equity funds, and foreign money sources. You can visit Rick Tobin at RealLoans.com for more details.



California’s Gold Rush for Valuable Land

Image from Pixabay

By Rick Tobin

California’s nickname is the “Golden State” for many reasons as it relates to the gold discovered at Sutter’s Mill by James Marshall near the city of Coloma in 1848, skyrocketing real estate prices, a Top 5 global economy ranking, and consistent warm sunshine. Of all of the assets ever discovered in California’s history since it joined the union as the 31st state in 1850, land that is buildable has been proven to be the most valuable asset of them all.

los-angeles-1790986_1280Image from Pixabay

By the end of December in 2020 during a global pandemic designation, the median price of a California home was published by the California Association of Realtors (CAR) as being a shocking $717,930 value. In January 2021, CAR reported that statewide median home prices rose +21.7% year-over-year. Statewide home prices surpassed $700,000 in August 2020 for the first time ever. For example, a 21.7% price gain for a $700,000 home would be equivalent to a staggeringly high $151,900 equity gain in just 12 months. For more expensive coastal homes that are valued near $2 to $5 million, a 21.7% year-over-year price gain would be be as follows: ● $2,000,000 home value = +$434,000 annual price gain ● $3,000,000 home value = +$651,000 annual price gain ● $4,000,000 home value = +$868,000 annual price gain ● $5,000,000 home value = +$1,085,000 annual price gain

The Priciest California Counties by Region

Let’s take a look below at recent county price trends for California to better understand how high median home prices have risen so high. For January 2021, the California Association of Realtors (CAR) reported the following most expensive median prices for these Southern California regions:

Southern California Counties

#1 Orange: $971,000 #2 Ventura: $776,000 #3 San Diego: $730,000 #4 Los Angeles: $697,660 #5 Riverside: $495,500 #6 San Bernardino: $390,000

Central Coast Counties

#1 Santa Cruz: $1,100,000 #2 Santa Barbara: $920,000 #3 Monterey: $860,000 #4 San Luis Obispo: $698,000

Bay Area Counties

#1 San Francisco: $1,745,000 #2 San Mateo: $1,605,000 #3 Santa Clara: $1,375,000 #4 Marin: $1,350,000 #5 Alameda: $1,060,000 #6 Napa: $835,000 #7 Contra Costa: $765,000 #8 Sonoma: $715,000 #9 Solano: $510,000 https://www.car.org/en/marketdata/data/countysalesactivity

san-francisco-1258848_1280

Image from Pixabay

California’s Top 5 Global Economy

By 2018, California had surpassed the United Kingdom as the 5th largest economy in the world if it were listed as a separate nation. The fact that London, and the rest of the United Kingdom, is one of the most powerful, wealthiest, and historic regions in world history and is behind the Golden State in terms of economic size is quite impressive. Listed below are the Top 10 largest world economies: 1. United States $19.391 trillion 2. China $12.015 trillion 3. Japan $4.872 trillion 4. Germany $3.685 trillion 5. California $2.747 trillion 6. United Kingdom $2.625 trillion 7. India $2.611 trillion 8. France $2.584 trillion 9. Brazil $2.055 trillion 10. Italy $1.938 trillion Source: International Monetary Fund (2018 data) In 2019, it was reported that California was closer to $3.2 trillion in annual economic output. Because California has such a diverse employment market that ranges from entertainment in Hollywood to multi-billion and trillion dollar digital media and marketing companies in Silicon Valley like Apple, Alphabet (parent of Google), and Facebook, the future continues to look bright for the Golden State’s economy.

California’s Population Base and Finite Land Supply

los-angeles-1584089_1280

Image from Pixabay

There are approximately 40 million residents in the Golden State. As of January 2020, the US Census Bureau reported that the US had a population base of 330 million. This translates to California residents representing 12.12% of all US residents.
The famous film and stage actor, writer, and witty humorist from Pacific Palisades, California named Will Rogers once said: “Buy land. They ain’t making any more of the stuff.”
Another historic quote by Harold Samuel, the founder of Land Securities which was one of the United Kingdom’s most successful property companies, about the key to success in regard to how to make money in real estate is as follows: “Location, location, location.” California is filled with an abundant supply of land that is adjacent to the majestic Pacific Ocean and includes scenic rivers, mountain ranges, and forests up and down the state which borders Mexico, Nevada, Arizona, and Oregon. Our state is 1,040 miles in length and 560 miles in width. There are an estimated 156,000 square miles of land and an additional 7,734 square miles that are covered by water for a grand total size of 164,000 square miles. If you flew on an airplane between two airports in the state that didn’t fly over the Pacific Ocean, you’d probably see primarily empty land regions. Did you know that our 40 million residents live on approximately just 5.4% of the state’s entire available land supply?

san-2117290_1920

Image from Pixabay

Almost 95% of California has no people living on it due to very strict zoning and usage laws and incredibly high building costs like environmental-impact study and “sustainable living” or green home building fees. Lumber prices have reached all-time record highs in early 2021 after topping $1,000 per 1,000 board feet for the first time ever. The combination of costly environmental-impact fees and rising lumber supply costs are two of the main reasons why there haven’t been many affordable homes or apartments developed in the state. If we divide 156,000 square miles of available California land supply by the estimated 5.4% of land that’s allowed to have residents living there, this means that only 8,424 square miles of California has residential or commercial real estate and residents on it. If so, this is equal to 4,748 California residents per square mile of the buildable land supply. Let’s put this 8,424 square miles of buildable land in the Golden State into better perspective by comparing it to other US regions: ● All of the Hawaiian Islands combined: 6,422 square miles ● The Big Island of Hawaii by itself: 4,028 square miles ● The state of Connecticut: 5,543 square miles ● Puerto Rico: 3,515 square miles

Money Supply + Land = Golden Returns

Most California residents created the bulk of their family’s overall net worth from the acquisition of residential property, both owner-occupied and investment. Few places in world history have experienced real estate booms like California as seen in recent years especially. Most California homebuyers or investors need third-party money sources to get into and out of a property. This is because generally there are more buyers who need mortgages to purchase a property than there are all-cash buyers. Conversely, the same homebuyer is likely to later become a home seller who needs a qualified new homebuyer who has access to his or her money sources to close the sales transaction. As California home prices skyrocket, the loan limits for conforming, FHA, VA, non-QM, and other types of creative money sources from places like hedge funds, insurance companies, and banks rise as well. For example, the high-cost conforming loan limits for the more pricey California counties were increased to $822,375 (97% loan-to-value). Or, a home, condominium, or townhome may be purchased with as little as 3% down payments up to almost an $850,000 purchase price.

business-861325_1280

Image from Pixabay

More flexible FHA loan products which allow lower credit scores and cash reserve allowances may require 3.5% down payments up to the similar $822,375 loan amount. Quite surprisingly, VA loans for qualifying active military or veterans have the option to purchase a single unit property (home, condominium, townhome) up to as high as $1.5 million with no money down and with 100% loan-to-value financing. After June 2020, both Fannie Mae and Freddie Mac began really tightening up their underwriting requirements for self-employed borrowers partly due to serious concerns about rising unemployment rates and collapsing small to midsize businesses. Fannie and Freddie are the two largest secondary market investors in America that purchase a high percentage of 30-year fixed mortgage loans and other loan products. The Jumbo mortgage market also started to freeze up after an increasing number of lenders stopped lending on larger mortgage amounts for owner-occupied, second home, and rental properties for one-to-four units. As a result, it forced more self-employed and high net worth borrowers to seek out non-conventional mortgage alternatives with funding sources from mortgage companies like mine who are partnered with more flexible hedge funds at prices that are very competitive with other loan products with or without income verification up to several million dollar loan amounts. There’s a finite supply of both prime buildable California land and access to affordable and flexible money to purchase and sell these same property assets. As the number of buyers for California properties continues to far exceed the diminished available listing supply, you should better understand why homes have increased 10%, 20%, 30%, and 40%+ annually in various statewide regions. If you have access to land and money, then you’re well on your way to prospering here in the Golden State just like how the early Gold Rush settlers panned for gold.
Rick-Tobin-Professional-Pic-sharper

Rick Tobin

Rick Tobin has a diversified background in both the real estate and securities fields for the past 30+ years. He has held seven (7) different real estate and securities brokerage licenses to date, and is a graduate of the University of Southern California. Rick has an extensive background in the financing of residential and commercial properties around the U.S with debt, equity, and mezzanine money. His funding sources have included banks, life insurance companies, REITs (Real Estate Investment Trusts), equity funds, and foreign money sources. You can visit Rick Tobin at RealLoans.com for more details.