Southern California’s Historic Housing Boom: Canyon Lake & Long Beach Spotlights
By Rick Tobin
Did you know that approximately 25 million people, or 63% of California’s 40 million residents, live in the 10 counties located in Southern California (San Luis Obispo, Kern, Santa Barbara, Ventura, Los Angeles, Orange, San Diego, Riverside, San Bernardino, and Imperial)?
San Bernardino County is the largest county in the nation by land size that spans over 20,100 square miles. Los Angeles County is the most populous county in the nation, with more than 10 million residents.
There are few places more beautiful in the entire world than the Southern California region. It’s been said that the three most important factors that cause home prices to rise are due to “location, location, and location.” California’s historic price boom over the past 55+ years is more proof why as it will be shared next with more details.
article continues after advertisement

The Extreme Dollar & California Home Seesaw Ride
As the dollar’s purchasing power falls, home values tend to rise. Most of the dollar’s decline in value took place during the 55-year time period that followed President Nixon’s removal of the dollar from the gold standard starting in 1971.
The purchasing power of the dollar has fallen by -87% between 1971 and 2026. $100 in 1971 fell to an equivalent purchasing power in these years: 1981 ($45), 1991 ($30), 2001 ($23), 2011 ($18), 2021 ($15), and 2026 ($13). What you could purchase for $100 in 1971 is now similar to what you can buy for $13 in 2026.
Because real estate is an exceptional hedge against inflation and an imploding dollar somewhat like an inverse seesaw, California median home prices increased by a whopping +3,361% during the same time period between 1971 and 2026.
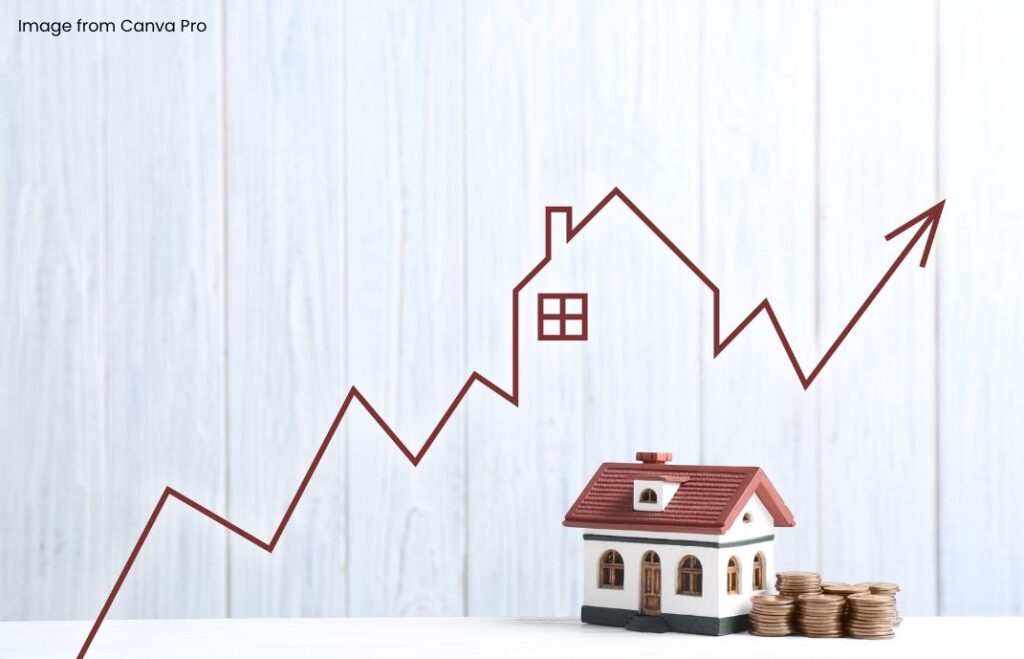
By Q2 2026, the statewide California median single-family home price reached $930,260, as per various sources like CAR (California Association of Realtors) and NBC. When compared to the historical statewide median price of $26,880 in 1971, California home prices rose a staggering +3,361% higher, while representing a home price increase of about $903,380.
To put these numbers into better perspective, if you adjust 1971’s home prices for cumulative national inflation over the same time period, which is roughly 833%, a comparable home would’ve cost somewhere between $250,000 and $270,000 today. Yet, the actual appreciation of California home prices far outpaces general inflation at a pace of 2,528% higher (3,361% – 833%) between 1971 and 2026.
As such, California truly is the “Golden State” in more ways than one.
California’s Safer Gated Communities
California and Florida were the two states that created the master-planned home communities behind gates starting with the Temple Terrace, Florida community, which was America’s first master-planned golf course community built in 1925. Shortly thereafter, Rancho Santa Fe in San Diego County followed in 1927 here in Southern California.
Gated golf course communities were later truly perfected in Riverside County, California out in the Greater Palm Springs or Coachella Valley region starting with the opening of the Thunderbird County Club in Rancho Mirage in 1951.
Did you know the popular Ford Thunderbird car was named after this country club because the Ford Chairman at the time named Ernest Breech was a golf club member? Thunderbird Country Club was also the credited birthplace of another form of transportation called the motorized golf cart.
Famous celebrity residents and members at Thunderbird included Lucille Ball and Desi Arnaz, Bing Crosby, Bob Hope, Frank Sinatra, Dean Martin, Clark Gable, Gerald and Betty Ford, and Perry Como.
Later, gated communities were built all across Coachella Valley that were designed around golf courses, tennis courts, and small lakes.
Both celebrities and non-celebrities began to truly appreciate the privacy and feelings of safety that gated communities offered them.
article continues after advertisement

California’s Very Few Gated Cities
Most gated communities are just very large HOAs (Homeowners Association) or POAs (Property Owners Association filled with homes and vacant lots) instead of actual separately gated cities. However, there are a few exceptions to this rule.
Technically, there may only be three gated cities in California as follows:
1. Canyon Lake (Riverside County): It’s the largest gated California city, right between Lake Elsinore and Menifee, with their own beautiful lake, golf course, fire department, and soon-to-be brand-new police department that’s scheduled to open up for business in August 2026, following their ribbon-cutting event on Friday, July 31st at 4 pm PST at the Canyon Lake Towne Center.
2. Hidden Hills (Los Angeles County): An entirely gated, incorporated city in the Santa Monica Mountains that’s best known for horse trails, lack of streetlights, and celebrity residents.
3. Rolling Hills (Los Angeles County): It’s located on the beautiful Palos Verdes Peninsula, just north of Long Beach and San Pedro. Every single property there is zoned as a ranch with mandatory horse trails.
Other regions often mistaken as “gated cities” include Coto de Caza in Orange County, which is technically a Census-Designated Place (CDP) rather than an incorporated gated city, and Bradbury Estates in Los Angeles County that’s partially gated.
Because many coastal Southern California homes are priced in the millions, a larger number of residents are moving to the Inland Empire (Western Riverside County, especially) instead of packing up and moving out of state hundreds or thousands of miles away from family and friends. To learn more details, this is a very interesting 8-minute video: Why Everyone is Moving to the Inland Empire.
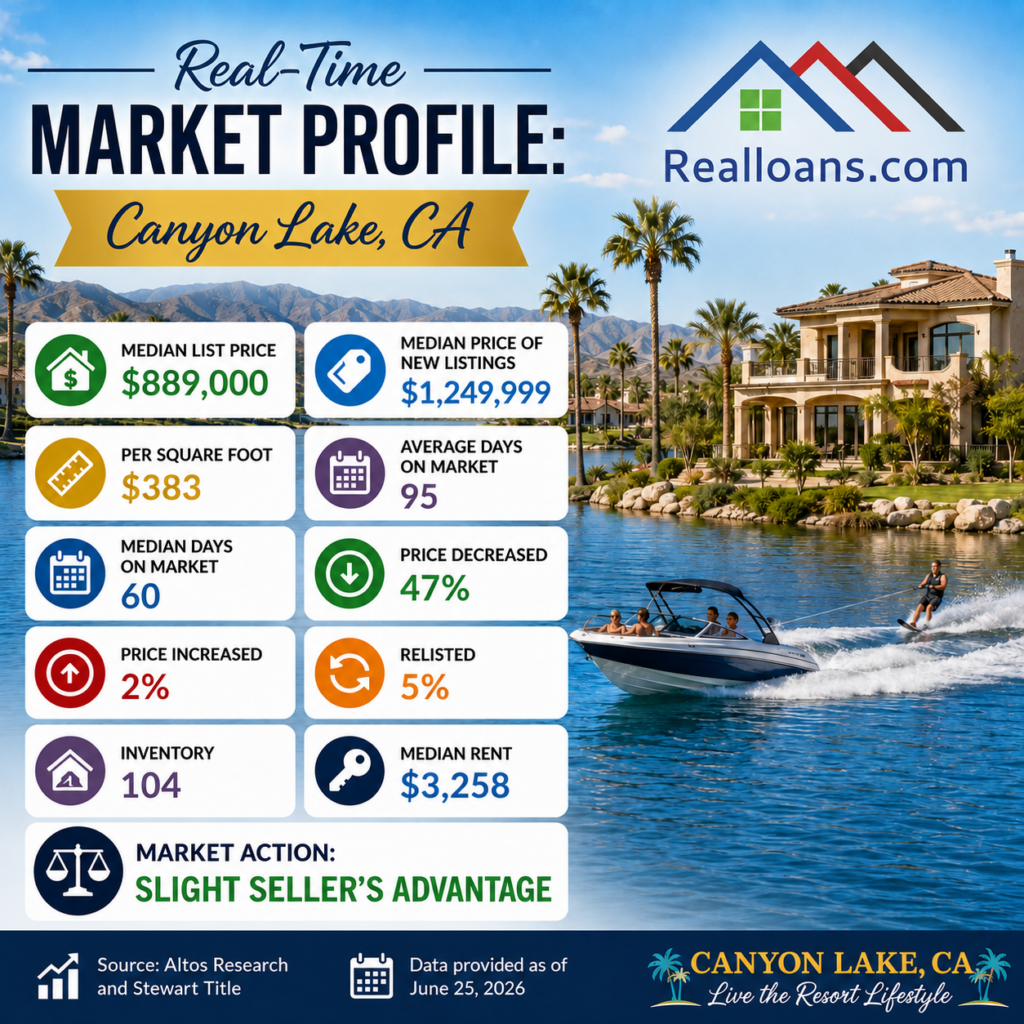
So-Cal City Spotlight: Canyon Lake (“A Bit of Paradise”)
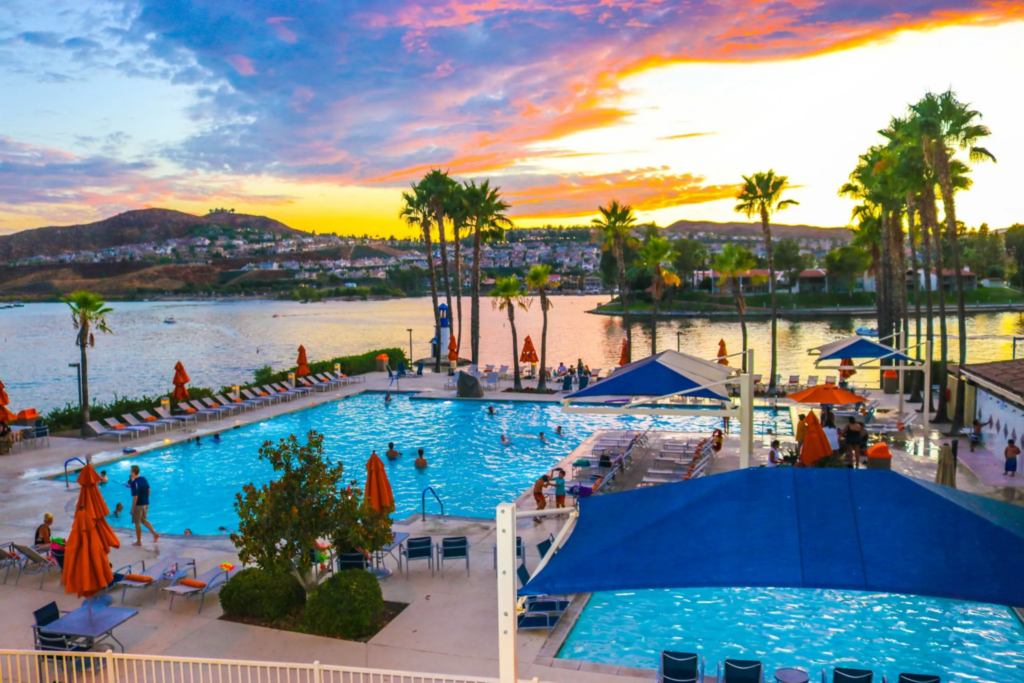
Source: Canyon Lake Insider
Let’s first learn why Canyon Lake is attracting so many new residents and businesses from the President and CEO of the Canyon Lake Chamber of Commerce named Johnny Pineda:
“Canyon Lake continues to stand out as one of Southern California’s most desirable communities because it offers far more than beautiful homes, it offers an exceptional lifestyle. Buyers are drawn to its private lake, resort-style amenities, strong sense of community, and convenient access to surrounding employment centers, making it an attractive place to live, invest, and raise a family.
For business owners, Canyon Lake provides a loyal, engaged customer base and a Chamber of Commerce committed to fostering economic growth through meaningful partnerships and community involvement. It’s a community where quality of life and long-term value go hand in hand.”
The Origins and Evolution of Canyon Lake
Canyon Lake was first established back in 1968. The original architect for Canyon Lake designed it after my old hometown of Huntington Harbour.
Lots could be purchased as low as $5,000 to $10,000 as my family knows firsthand because my father purchased a $5,000 lot so that we could pull our ski boat from Huntington Beach to Canyon Lake and water ski there.
Let’s take a closer look at how this region grew in size over the past 58 years:
* Late 1960s to 1970s (Development): The Kaiser Land Development Company began developing and marketing the area as a country estate and recreational destination. Vacant lots started to sell at prices between $14,000 to $25,000 during the 1970s and beyond.
* 1980s to 1990s (Growth): As both the I-15 highway corridor and Inland Empire expanded, Canyon Lake transformed from a vacation destination into a primary commuter hub. By the mid-to-late 1980s, single-family homes were selling somewhere within the $130,000 to $230,000 price range.
* The 2000s Boom & Crash: Home values really started to appreciate in Canyon Lake just like most of the rest of California between 2002 and 2006 or 2007 near the previous housing market peak. The median home price broke the $300,000 mark by 2003 and later peaked near $425,000 in 2005. Subsequent to the housing bust meltdown following 2008, prices fell nearly 50% back into the $200,000 price range by 2009 to 2011. California home prices fell -41.7% from peak-to-trough between 2008 and 2012, so Canyon Lake’s losses were worse than median statewide losses.
* 2012 – 2019 (Recovery): The housing market began to stabilize before later shooting skyward throughout the 2010s years. By 2018, the Canyon Lake median home sales price reached almost $414,000.
* 2020 – 2026 (Pandemic & Record Low Rate Surge): Home prices began to really increase as more coastal Southern California residents, who could no longer afford multi-million dollar fixer uppers by the beach, discovered Canyon Lake and moved out here in large numbers. Canyon Lake median home prices fluctuated between $750,000 and to more than $900,000. Some new home listing prices today for large waterfront homes are in the $4 to $5 million dollar price range.
Canyon Lake effectively offers affordable waterfront living in Riverside County that’s within a 1-hour to 1.5-hour driving distance for residents to places like Huntington Beach, Newport Beach, Laguna Beach, Los Angeles, San Diego, and to the Palm Springs region east of Canyon Lake.
Canyon Lake was just ranked #2 on the 8 Best Lake Towns in the U.S. for Retirees list in June 2026 by Travel and Leisure.
The adjacent Canyon Hills master-planned community, which first broke ground in 2001, is another very nice community that has almost the same number of 11,000 to 12,000 residents as Canyon Lake.
While being more affordable than Canyon Lake and located in the city of Lake Elsinore (largest freshwater lake in Southern California), most of the Canyon Hills homes are newer and development continues onward to this day. Canyon Hills has also been the fastest-growing home development community in Riverside County over the past 25 years.
On the other side of Canyon Lake is the city of Menifee with upwards of 125,000 residents, which was just ranked as the only “boom town” located in Southern California by SmartAsset because of their +29% growth rate over the past five years.
Thanks to the old real estate theory known as the principle of progression, the higher-priced waterfront homes in Canyon Lake are helping the adjacent home values in Canyon Hills and Menifee move higher due to being so close to this prime location with multi-million dollar homes.
For more details about the latest real estate trends in these three booming regions, please follow my Facebook page entitled Real Estate Insights for Canyon Lake, Menifee, and Lake Elsinore.
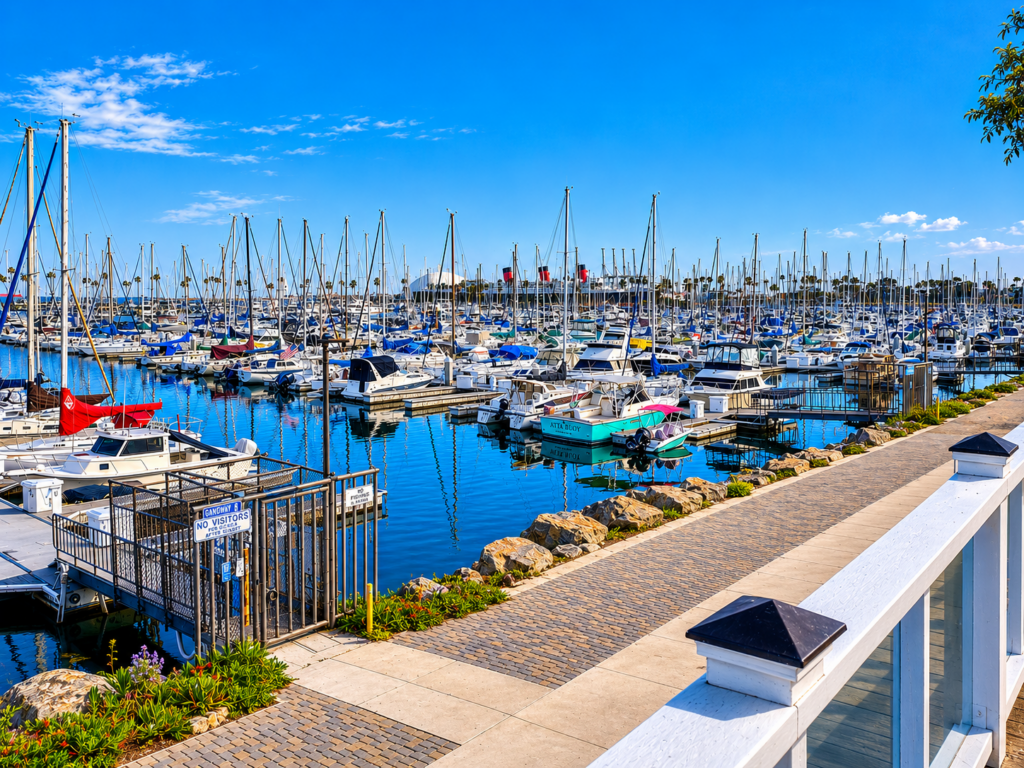
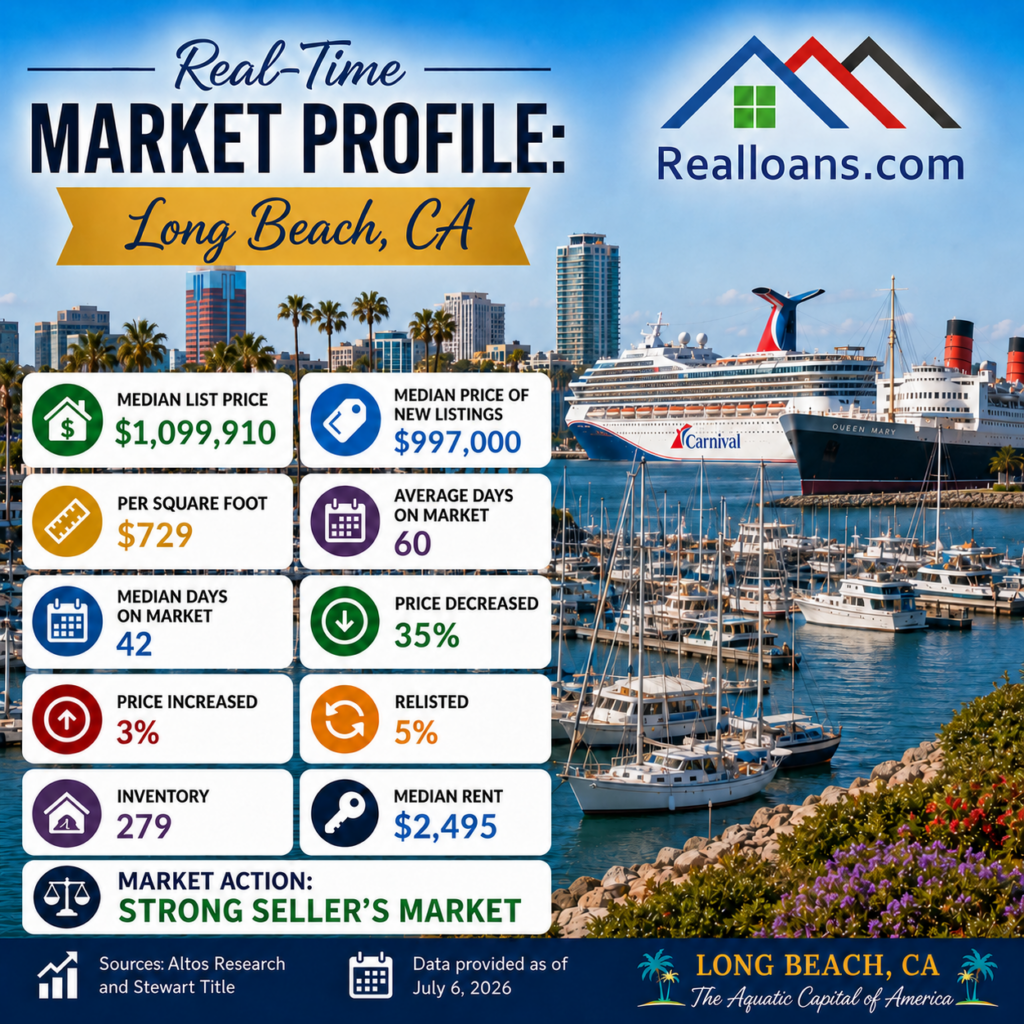
So-Cal City Spotlight: Long Beach (“Aquatic Capital of America”)
Could Long Beach be considered as the most “affordable unaffordable beach city” in Southern California? How can this seemingly contradictory “affordable unaffordable” oxymoron be true at the exact same time?
Let’s take a closer look at the amazing city of Long Beach:
The Top 4 Most Unaffordable Housing Regions in the World
The Top 4 Least Affordable Housing Regions in the World (home price-to-household income ratio) are all located in California:
1. San Jose
2. Los Angeles
3. Long Beach (2nd largest city in Los Angeles County after the City of Los Angeles and 7th largest in the state)
4. San Diego
Source: Remitly
The Top 7 largest California cities are: 1. Los Angeles, 2. San Diego, 3. San Jose, 4. San Francisco, 5. Fresno, 6. Sacramento, and 7. Long Beach.
The most densely-populated area in America is in the Los Angeles-Long Beach-Anaheim metropolitan region, with more than 13 million residents.
Long Beach’s Household Income
While Long Beach is one of the most beautiful regions in the world with a very diverse economy, their home prices are somewhat reasonable as compared with nearby coastal regions in Seal Beach, Huntington Beach, Newport Beach, and Palos Verdes.
This is partly because the median household income range in Long Beach is somewhere within the $87,000 to $91,000 range for one, two, or more worker occupants in the same household.
This is a core reason why Long Beach was listed as the #3 most unaffordable housing regions in the entire world on a home price-to-household income ratio basis.
Long Beach and San Pedro (both described as the Port of Los Angeles) are the shipping port capitals here in America. In early 2026, Long Beach processed more shipped goods than any other port in North America.
Long Beach will host at least 11 different sporting events in 2028 when the Los Angeles Olympics takes place. As a result, new construction continues onward at a rapid pace with venues such as the Long Beach Amphitheater (largest waterfront venue on the West Coast with an 11,000 person capacity) that just opened in June 2026, which is right adjacent to the historic Queen Mary ship.
Quality of Life, Prime Locations, and Massive Home Price Gains
Southern California residents benefit from living in one of the most scenic locations on the planet, right adjacent to the world’s largest body of water called the Pacific Ocean. Yet, they also can grab their snow skis or snowboards and drive up to Big Bear Mountain in San Bernardino County on the same day when they surfed a wave earlier in the morning by the Huntington Beach Pier.
Some of the most amazing golf courses in the nation are located in Southern California, especially in the Newport Coast at Pelican Hills, Torrey Pines in La Jolla, Riviera Country Club in Pacific Palisades, Canyon Lake Golf & Country Club, or at more than 100 different golf courses in the Coachella Valley (Palm Springs, Palm Desert, Rancho Mirage, La Quinta, etc.).
I’m not sure that any other home region in America had a better +3,361% home price gain between 1971 and 2026 than Southern California. Even if there were a region with a more impressive home price percentage gain, it’s highly doubtful that their year-round climate and quality of life were better than in Southern California.
To learn more details about the benefits of living and investing in Southern California, please join my So-Cal Real Estate Club where we primarily meet in Canyon Lake, Long Beach, and online.

Rick Tobin has worked in the real estate, financial, investment, and writing fields for the past 30+ years. He’s held eight (8) different real estate, securities, and mortgage brokerage licenses to date and is a graduate of the University of Southern California.
Rick provides creative residential and commercial mortgage solutions for clients across the nation. He’s also written college textbooks and real estate licensing courses in most states for the two largest real estate publishers in the nation; the oldest real estate school in California; and the first online real estate school in California.
Please visit his website at Realloans.com for financing options, join his investment group at So-Cal Real Estate Investors, and follow his new So-Cal Real Estate TV channel for more details.
Rick Tobin
Realloans (Real Estate Loans)
https://realloans.com/
Phone or Text: (760) 485 – 2422
NMLS 1934868
Equal Housing Opportunity / Equal Housing Lender
To quickly apply online: Loan Application
For our real estate course: Learn Real Estate
Please follow our new real estate channel (watch on television, computers, and phones): So-Cal Real Estate TV
Our Facebook business pages: Realloans, Inside Los Angeles, Inside Pacific Palisades, Inside Long Beach, Inside Huntington Beach, Inside Orange County, Inside La Jolla, Inside San Diego, Inside Lake Elsinore, Inside Temecula Valley, Inside Coachella Valley, and So-Cal Real Estate Investors.
Here are some of my articles: The Fall of 2025 and Rise of New Opportunities, The Intersection of Declining Home Sales and Creative Marketing, Are Lower Rates on the Horizon?, Weather Extremes, Homes, and Insurance Risks, The California Gold Rush Boom, and Are You Focused on Commercial Real Estate?
Please join my So-Cal Real Estate Investors group that meets at Canyon Lake Golf & Country Club, Shoreline Yacht Club in Long Beach, and online: So-Cal Real Estate Investors.