The Interconnected California & Global Real Estate Markets
By Rick Tobin
Did you know that the median Southern California and statewide home prices have fluctuated between the $750,000 and $850,000 range over the past year? Generally, the housing price-to-household income for California has varied between 8x to 10x (times or multiplied) for home prices as compared to the qualifying household income. For example, a home with a purchase price of $800,000 is 10 times (10x) the combined household income of $80,000.
While California is usually one of the most expensive places in America to own or lease a property, it’s still “affordable” in comparison to these Top 10 most expensive home price-to-household income locations on the planet which are as follows:

#1 Shanghai, China – 46.6x
#2 Beijing, China – 45.8x
#3 Hong Kong, China – 44.9x
#4 Colombo, Sri Lanka – 43.7x
#5 Beirut, Lebanon – 41.3x
#6 Shenzhen, China – 40.1x
#7 Manila, Philippines – 37.6x
#8 Guangzhou, China – 37.3x
#9 Mumbai, India – 36.6x
#10 Ho Chi Minh City, Vietnam – 34.5x
Source: Numbeo – Property Price Index 2023
The Top 10 priciest home regions have both skyrocketing home prices and annual wages that are extremely low which makes California and the rest of our nation seem reasonably priced when reviewing home price-to-income ratios.
The California economy is now the 5th largest economy in the world. Our economy is on a growth pace that may soon make it the 4th largest economy if our state surpasses Germany. We attract investors and new residents from around the world such as from Asia, Europe, Mexico and Latin America. In fact, there are more Hispanics or Latinos in California as of 2015 than any other race or ethnicity.
The Southern California (So-Cal) region within our state consists of upwards of 24 or 25 million residents located in 10 counties which include: Imperial, Kern, Los Angeles, Orange, Riverside, San Bernardino, San Diego, Santa Barbara, San Luis Obispo, and Ventura.
ADVERTISEMENT

So-Cal and U.S. Real Estate Trends
In the So-Cal Real Estate Investors – Canyon Lake group that I lead, we discussed the following real estate and financial topics at our latest in-person meeting at Canyon Lake Golf & Country Club on April 18th, 2023:
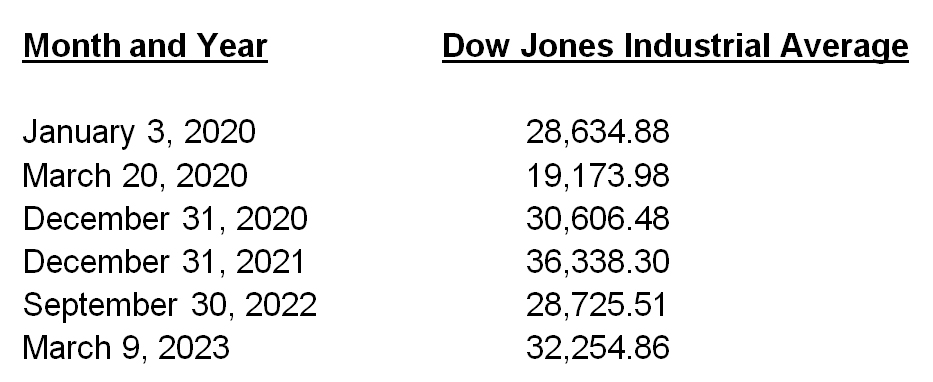
1. Home values over the next year could fall, be flat, or even increase if the Fed is forced to pivot and start rapidly cutting rates again. Be prepared for any and all investment possibilities and opportunities.
2. Home equity represents the core wealth: The bulk of a homeowner family’s overall net worth comes from the equity in their primary residence. The average US homeowner at retirement age has approximately 83% of their overall net worth tied up in the equity in their home and pays monthly expenses from the remaining 17% of overall net worth that’s held in checking, savings, or pension accounts.
3. Riverside-San Bernardino-Ontario, CA Metro Area (March 2023)

- Home Value: $542,000
- Median Household Income: $77,095
- Home Price to Household Income Ratio = 7.03x (5x is national avg.)
- Home Value Growth (Year-over-Year or YoY): 3.0%
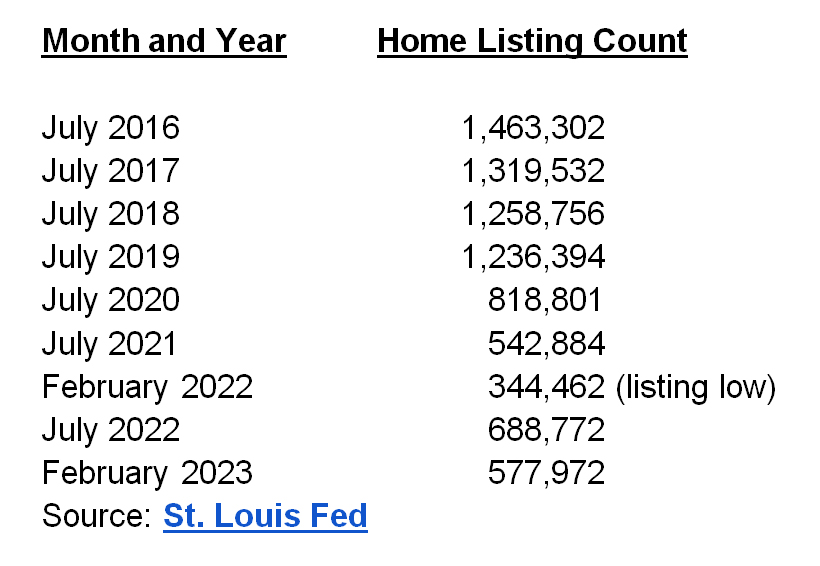
- For Sale Inventory: 7,511
- Sales Inventory Growth: 71.1% YoY
- Price Cut Share of Listings: 16.8%
- Rent for Apartments: 2,494/mo.
- Monthly House Payment: $3,426 (PITI)
- Rent for Homes: $3,243/mo.
- Monthly Difference Between Home Mortgage and Rent: $183
- Listing Inventory as % of All Homes: 0.5%
Sources: Realtor.com, Zillow, and US Census Bureau
“The difference between monthly mortgage payments and rents hasn’t been this big since 2006, around the peak of the housing bubble that led to the Great Financial Crisis, according to the National Multifamily Housing Council. Assuming a 10% down payment, the group found that a monthly payment on a 30-year fixed-rate mortgage was $1,176 more than renting an apartment up to the end of 2022. The buy-to-rent premium hasn’t been this steep since the third quarter of 2006.” – Business Insider
The exception to this current massively widening mortgage payment-to- rent trend is Riverside Metro with only a $183 monthly price difference.
4. Lack of a sufficient down payment is the most common reason why an individual or family can’t qualify to purchase a home unless they can qualify for a VA loan or even FHA loan with $0 down after factoring in seller credits and gift money. There are at least 311 down payment assistance (DPA) programs available to California residents and upwards of 2,300 DPA programs available nationwide, as per the Down Payment Resource group. Yet, many people are only familiar with the California Dream DPA program that had $300 million already committed to buyers in just the first 11 days before it shut down. Originally, the plan was for California to offer first-time buyers up to $500 million, but the state had to use $200 million of those earmarked funds to cover other budget deficits.
5. Short-Term Rentals: Coachella Valley had the highest March/April 2023 ADR (Average Daily Rent) of the top 50 short-term rental markets partly due to the Coachella and Stagecoach music festivals; U.S. short-term rentals earned over $62 billion in revenue in 2022, which was a 25% year-over-year increase; San Diego was the most profitable Airbnb metropolitan region in the world in 2021; Big Bear City was ranked #8 in the entire world for highest-grossing Airbnb revenue in 2020; and Moreno Valley was the most profitable Airbnb city in the U.S. in 2019.
Investors can qualify with as little as 15% cash down using DSCR (Debt Service Coverage Ratio) programs where the current or proposed rents cover the proposed monthly mortgage payment (PITI and HOA, if applicable) on an EZ-Doc type of basis.

Flipping homes or paper: With even shorter term real estate options that may be be completed within hours or days, you can either flip properties or paper such as lease-options, wholesale purchase contract assignments, seller-financed notes or deeds, or partial income streams from beneficial or lender interests in the promissory note (“IOU for debt”) or trust deed.
6. Distressed mortgage and rental property data from 2021. Today’s 2023 numbers are probably significantly worse and rarely published.
- An estimated 15 million people lived in households that owed more than $20 billion in unpaid rent as of July 2021.
- 7.43 million rental property units were not current.
- 5.95 million owner-occupied housing units weren’t current.
- 8.71 million lived in owner-occupied homes where the homeowners have little or no confidence in their ability to pay their mortgage.
- 12.71 million lived in rental properties where the heads of household had little or no confidence in their ability to pay their rent.
- Serious mortgage delinquencies were up 20% in July from June and were the highest recorded since 2010.
- By mid-August 2021, 3.9 million homeowners were in active forbearance, which represented 7.4% of all mortgages nationwide and $833 billion in total unpaid principal.
- An estimated 11.6% of all FHA and VA loans were in active forbearance.
Sources: U.S. Census Bureau and Black Knight Mortgage Monitor
7. 2023 Consumer Debt Data and Trends: It’s claimed that upwards of 15,000 cars are repossessed every single day here in the U.S. alone. Mortgage and all consumer debt and payment rates and fees all just hit record highs at the same time. Average DTI (debt-to-income) ratios for existing mortgage borrowers reached an all-time record 44% DTI and FHA defaults reached almost 12% in February 2023.

Average interest rates (March ‘23):
– Credit Card: 24.5%
– Used Cars: 14.0%
– New Cars: 9.0%
Meanwhile, we have record levels of debt:
– Total Household Debt: $16.5 trillion
– Auto Loans: $1.6 trillion
– Credit Card Debt: $986 billion
– Student Loans: $1.6 trillion
The interest on student loans has been suspended since 2020 due to Covid, but is set to resume later this year. How many defaults will happen?
8. Understanding Credit: FICO scores range from 300 to 850. The higher the score, the better the credit grade. The three main credit bureaus or credit reporting agencies (CRAs) include Experian, TransUnion, and Equifax. The credit scores are derived from the following factors:
● Payment history—35%
● Amount owed—30%
● Length of credit history—15%
● New credit—10%
● Types of credit used—10%
New Credit Score Models: The average American has a FICO credit score near 690. In October 2022, the Federal Housing Finance Agency (FHFA) announced the approval of a new credit score rating system named FICO 10T and VantageScore 4.0 for use by Fannie Mae and Freddie Mac. FICO 10T and VantageScore 4.0 will consider payment histories from rent, utilities, and telecommunication bills. Yet, a rental payment history can be very bad for tenants on Covid moratoriums with years of no payments.
ADVERTISEMENT

9. Generational Home Purchase Trends: Between 2015 and 2022, the Millennial generation was ranked #1 overall as the largest generation of home buyers and tenants. Now, Baby Boomers (born between 1946 and 1964) take back the lead as the #1 home buyers partly due to having more cash and equity available from other properties. Senior housing and reverse mortgage opportunities are rapidly increasing as well.
“Baby boomers now make up 39% of home buyers – the most of any generation – an increase from 29% last year. Generation Z now makes up 4% of buyers, with 30% of Gen Z moving directly from a family member’s home into homeownership. When relocating, all generations are moving farther distances, with younger boomers (ages 58-67) moving the greatest distance at a median 90 miles away.” – National Association of Realtors
10. Ballooning Commercial Loans: $270B of commercial real estate loans are set to mature in 2023, which is an all-time record for loan maturities. An estimated $900 billion in commercial property loan debt may come due within just the next two years. If so, upwards of $630 billion dollars’ worth of commercial loans may come due in 2024 which would be 2.333 times the all-time ballooning commercial record loan set this year. How will this potentially affect commercial property value trends?
For more details, please visit www.socalrealestateclub.com.

Rick Tobin
Rick Tobin has worked in the real estate, financial, investment, and writing fields for the past 30+ years. He’s held eight (8) different real estate, securities, and mortgage brokerage licenses to date and is a graduate of the University of Southern California. He provides creative residential and commercial mortgage solutions for clients across the nation. He’s also written college textbooks and real estate licensing courses in most states for the two largest real estate publishers in the nation; the oldest real estate school in California; and the first online real estate school in California. Please visit his website at Realloans.com for financing options and his new investment group at So-Cal Real Estate Investors for more details.
Learn live and in real-time with Realty411. Be sure to register for our next virtual and in-person events. For all the details, please visit Realty411.com or our Eventbrite landing page, CLICK HERE.